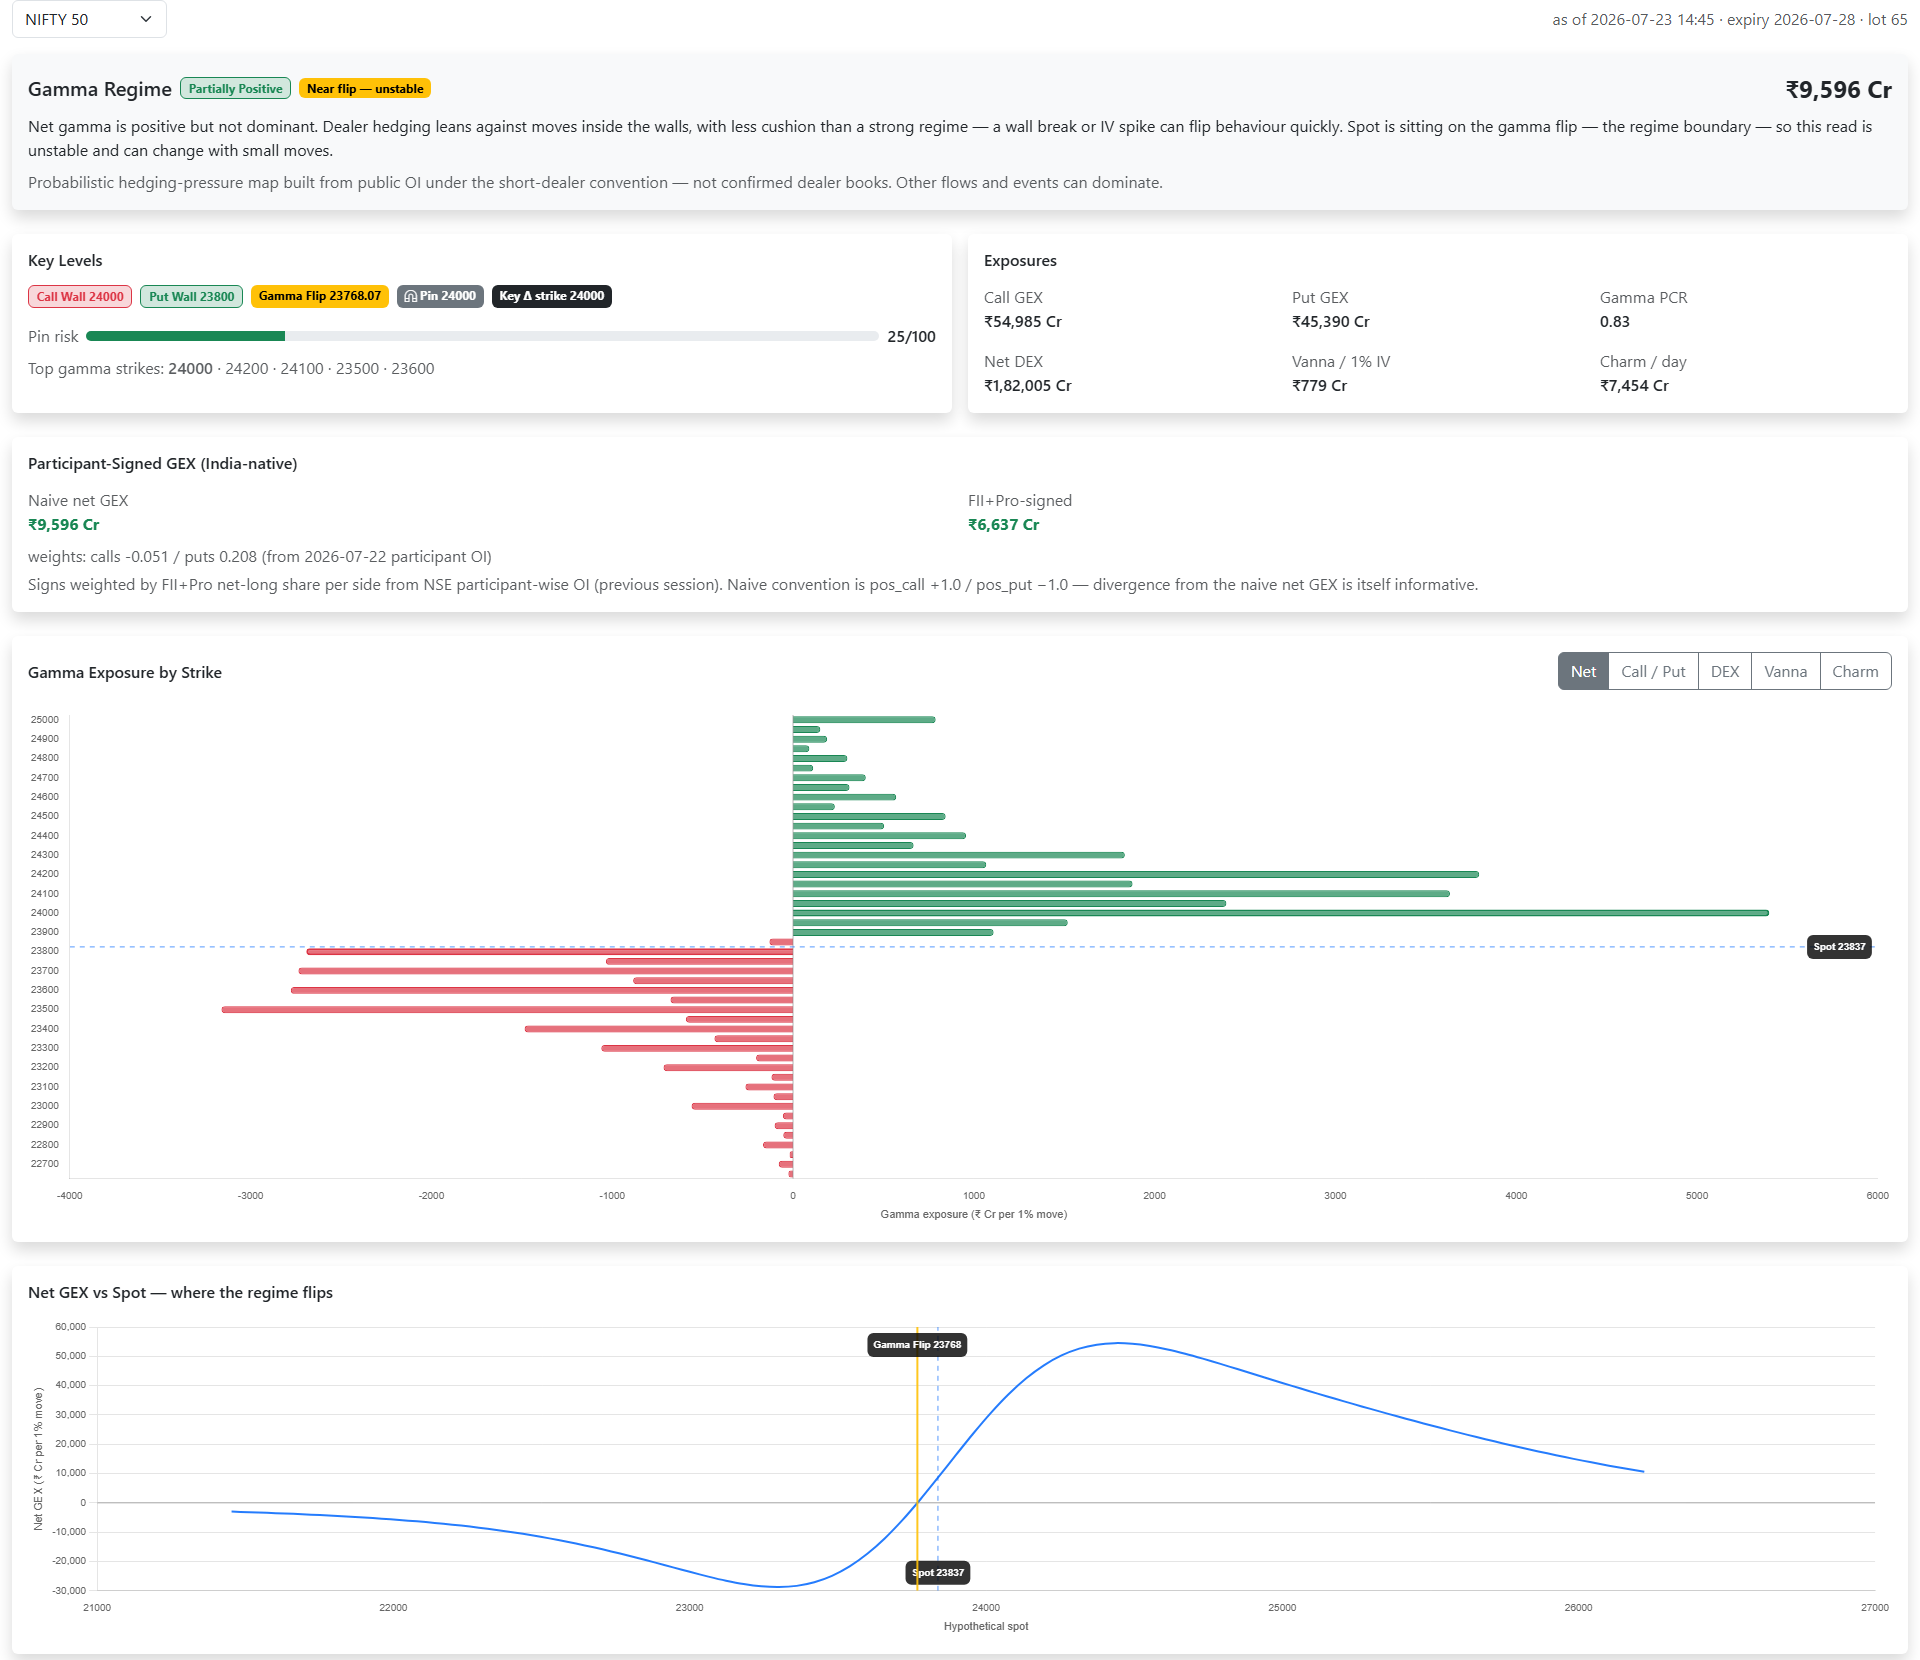
Gamma exposure is usually drawn as bars by strike, and the bars tell you where the hedging sits. They do not tell you the thing a desk actually needs to know: if the index moves half a percent from here, how many futures do we have to trade, and which way. The hedge ladder is that number, laid out for every price step from two percent below spot to two percent above, and it updates every minute on the Dealer Positioning page.
How the hedge ladder is built
An option dealer who has sold you a call owns a position that loses as the index rises. To stay neutral the dealer buys some futures (delta hedging), and how many depends on the option’s delta. Delta is not fixed: as the index rises the call’s delta rises too, so the dealer must buy more futures; as it falls the dealer sells some back. Gamma is the rate of that change. Add up every strike in the chain and you get the desk’s total delta at today’s spot, and, more usefully, what that delta would be at any other spot.
The hedge ladder does exactly that sum. For each price step it re-prices every strike’s delta at the new spot, using each strike’s own implied volatility and the time left to expiry, adds them up under the standard dealer convention, and reports the difference from today as the futures the desk must trade to get back to neutral. Negative means sell, positive means buy. The page shows the number in lots and in rupee crore, alongside the delta the book carries right now.
This is a full re-pricing, not a shortcut. A linear estimate that multiplies today’s gamma by the size of the move goes wrong exactly where it matters, at the walls, because gamma itself changes as price moves through a heavy strike.
Reading the sign
The sign is the whole story of the regime, and the hedge ladder shows it without any labels.
- When the desk is long gamma, its delta grows as the index rises and shrinks as it falls. The ladder reads sell above spot and buy below it. Dealers sell rallies and buy dips, moves get absorbed, and the tape is calmer than the news would suggest.
- When the desk is short gamma, the opposite: buy above, sell below. Dealers chase price, moves extend, and a small push can become a large one.
- On most days the ladder is not the same on both sides. Long gamma from calls above spot and short gamma from puts below it is a common shape: rallies get sold into the call wall while dips get sold harder. That asymmetry is exactly what the bars-by-strike chart hides.
The flip level on the same page is the price at which the sign changes. The ladder is the flip level made concrete: it tells you how much has to be traded on the way there.
What a jump means
Most of the time the hedge ladder changes gradually from one step to the next. Occasionally one step needs two or three times the futures of the step before it, and the page marks that row. A jump means a cluster of strikes changes hands at that price: their deltas swing from near zero to near one, or back, over a very short distance. In practice that is what a wall feels like from the inside. Price approaches, the desk’s required hedge balloons, and the resulting flow either absorbs the move, if the desk is long gamma there, or accelerates it, if short.
So the reading is simple. A jump above spot on a long-gamma day is a ceiling. The same jump on a short-gamma day is a launch pad. Which one you are looking at is the sign of the row.
Putting it together
The hedge ladder sits under the levels and corridor card on the Dealer Positioning page, and the two read best together. If gamma exposure itself is new to you, the GEX explainer covers the bars-by-strike chart the ladder is built from.
- Check the corridor first. The put wall is the floor, the call wall the ceiling, and the page reads the width against a normal day’s move. A tight corridor with small hedge sizes at both edges is a quiet, contained day.
- Look for the jump nearest spot. That is the first level where the tape’s character can change. Note whether the row says buy or sell.
- Check pin conviction. A stable or locked pin between two sell rows above and buy rows below is a pin the desk is defending for you. A pin with a buy-row jump just above it is a pin that becomes a breakout if price gets through.
- Use the sliders when an event is coming. The IV shock slider re-prices the whole map for the volatility crush that follows a policy decision or results; the time slider walks the map toward expiry. If the ladder flips sign under the shock, the post-event tape will not behave like the pre-event one.
A worked example makes the reading concrete. Spot is 24,000, the call wall is 24,200 and the row for a half-percent rise reads sell 380 lots while the row for a one-percent rise reads sell 1,900 lots and is marked as a jump. The desk is long gamma above spot, and the jump sits exactly where the wall is: a rally into 24,200 meets five times the selling of the first half-percent, which is why the wall behaves like a ceiling. Now flip the sign in your head. Had those rows read buy, the same wall would be the level where a rally accelerates.
Everything on the hedge ladder is computed from public open interest under an assumption about who holds the other side, so it is hedging pressure, not the desk’s actual book. It is also held at fixed open interest: real books reposition, and a burst of fresh writing can move a jump by a strike within minutes. That is why the page rebuilds it every minute of the session, and why the timeline lets you replay what it said at any earlier time. Read it as a map of where the mechanics get heavy, and let price tell you which side of the map you are on.