Expected Move — What Options Imply About Tomorrow's Range
By OIData Editorial Team ·
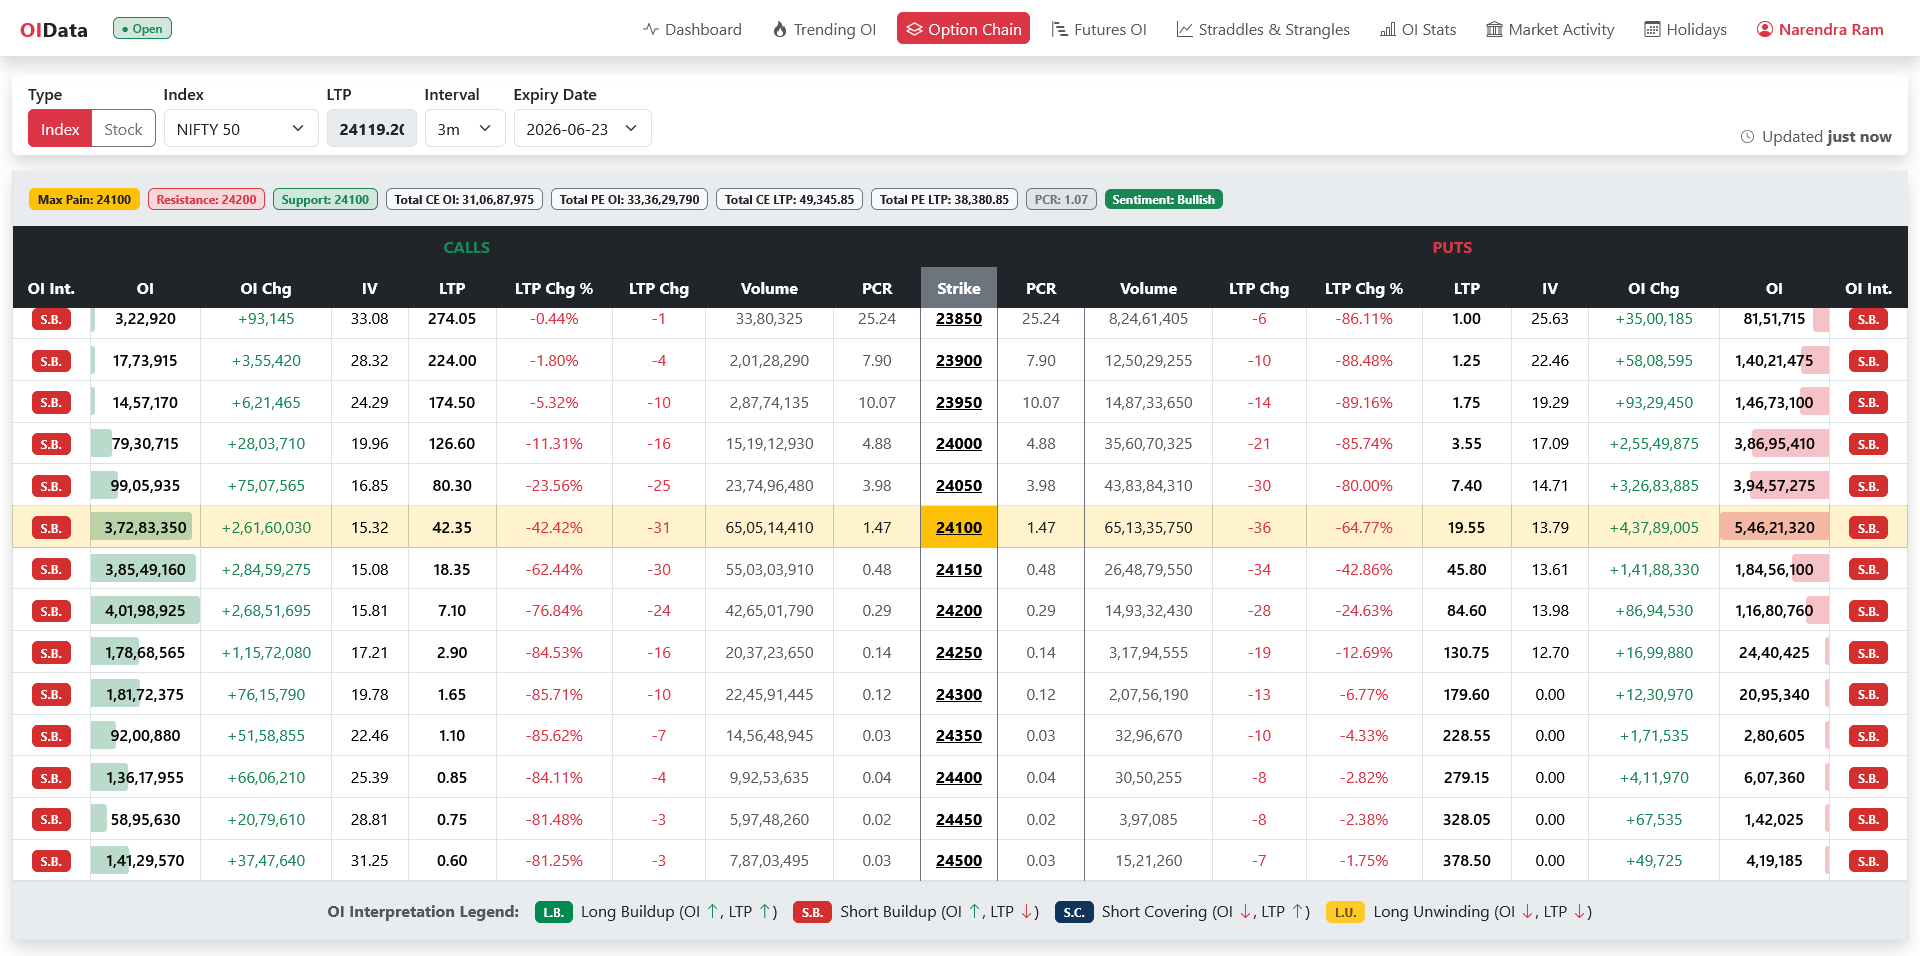
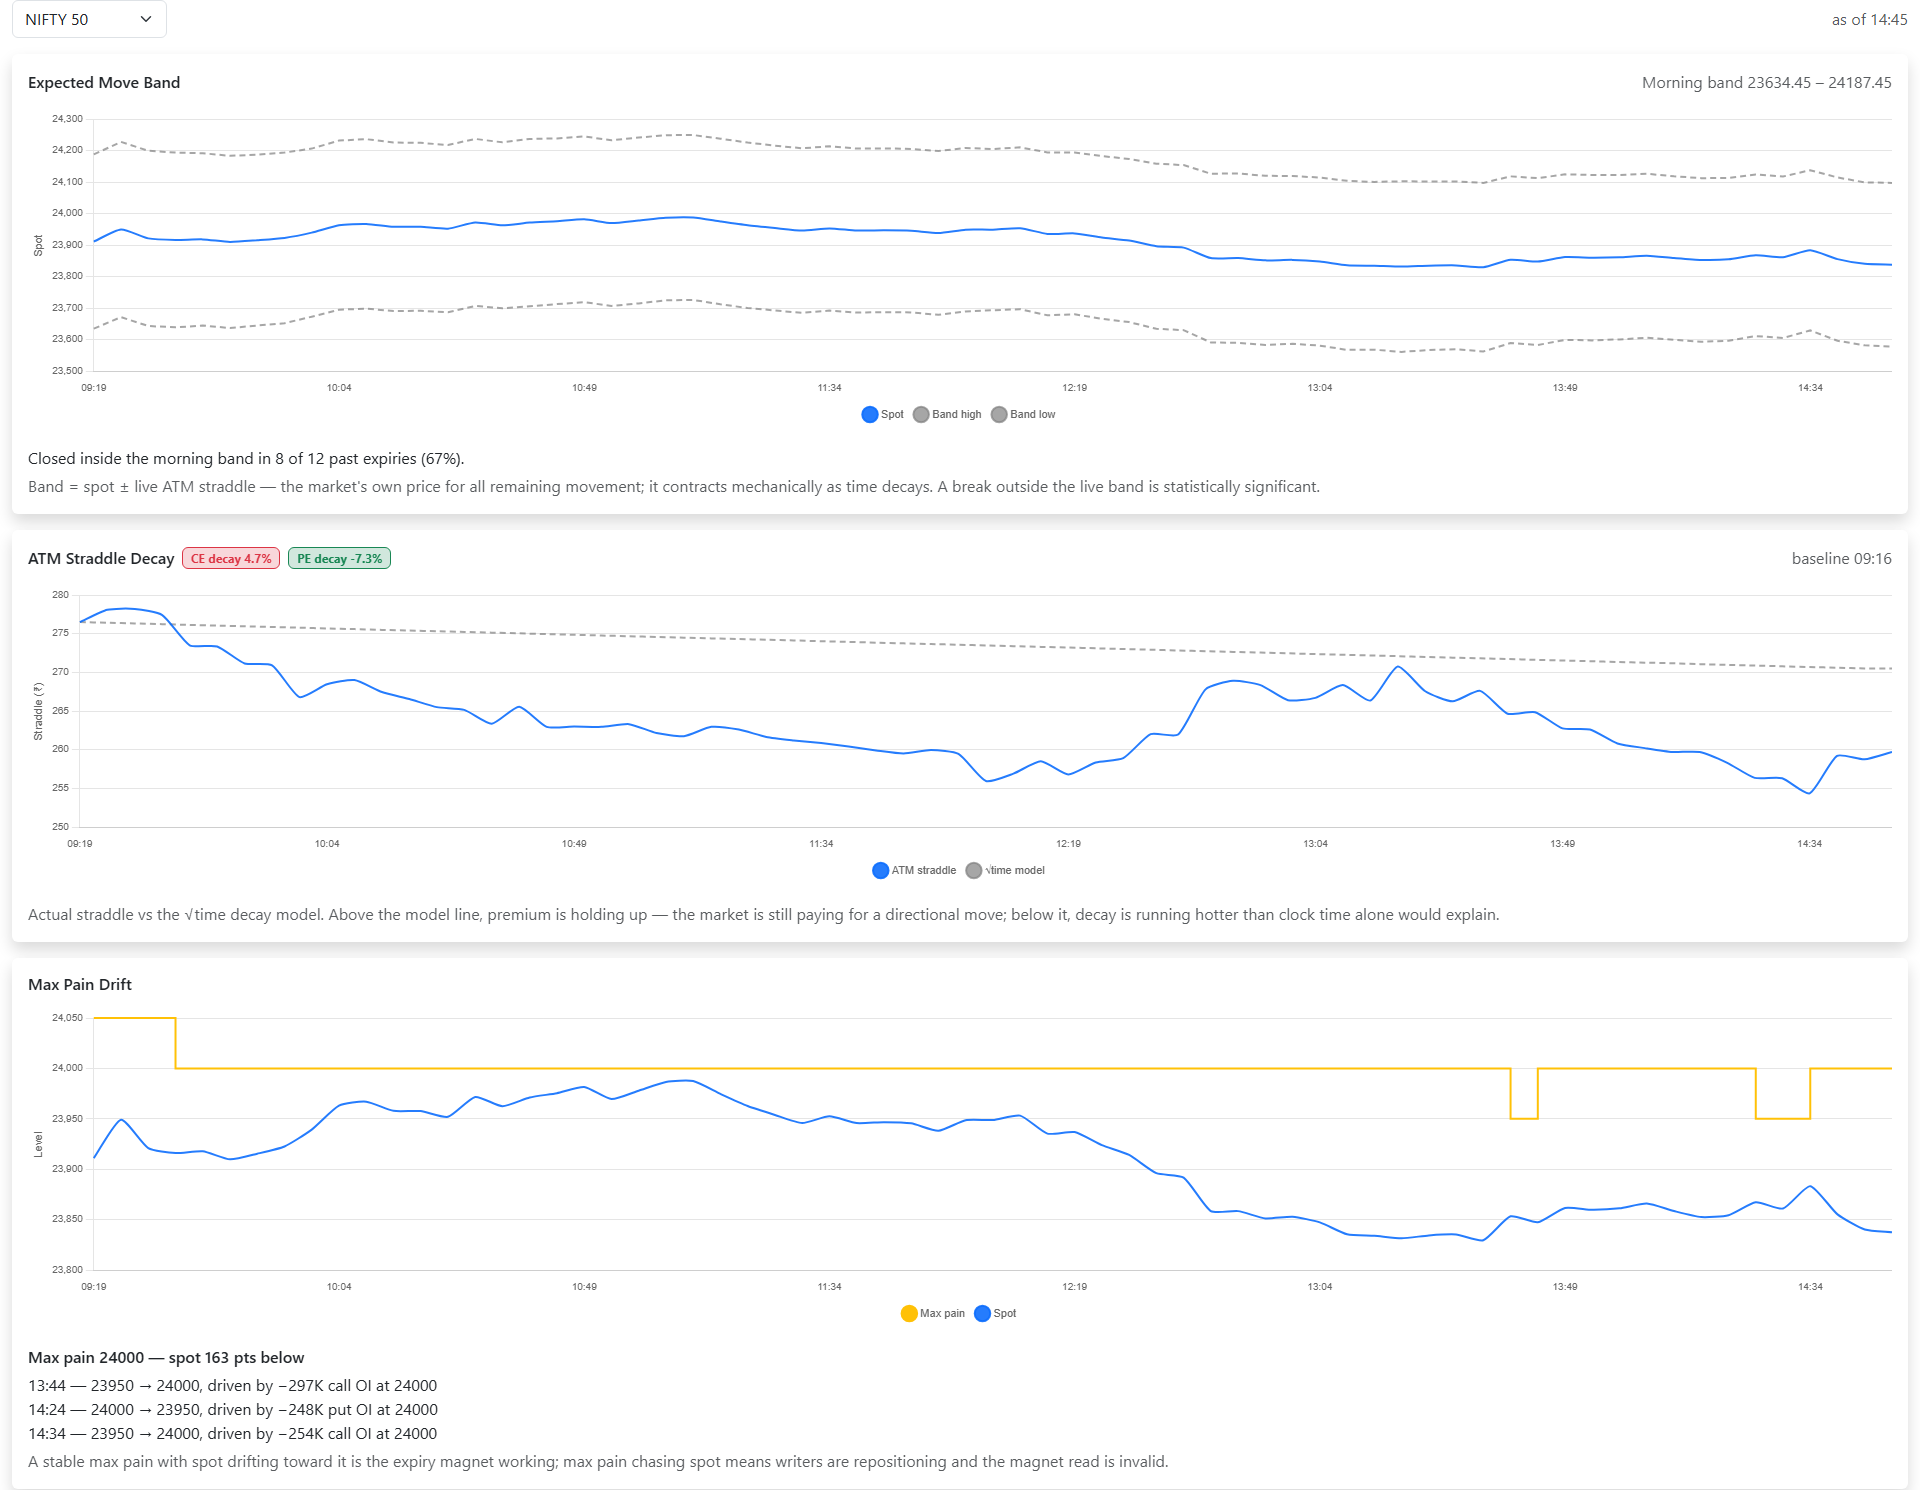
The market publishes its own forecast of how far it will travel, and it costs one addition to read: the at-the-money straddle. What it means and how to use it.
Expected MoveStraddleVolatilityOptions
Read more →