Some sessions NIFTY absorbs everything you throw at it. Every push off the lows fades, every dip gets bought, and the close lands twenty points from the open. Other sessions the same thirty-point move keeps going and doesn’t stop until it has travelled two hundred. The biggest structural reason for that difference is gamma exposure — how much option-hedging pressure is parked at each strike, and which way that hedging pushes when spot moves.
Gamma exposure, usually shortened to GEX, is not a forecast. It is a map of where hedging flows are likely to absorb price and where they are likely to accelerate it.
Delta, gamma, and why hedging direction matters
Two greeks drive all of this.
Delta is how much an option’s price changes for a one-point move in the underlying. Gamma is how fast that delta itself changes. An at-the-money option carries the most gamma — its delta swings from 0.4 to 0.6 as spot travels through the strike. A deep out-of-the-money option has almost none; its delta is pinned near zero and stays there.
Now think about who has to hedge.
Whoever is short options is short gamma, and their delta moves against them. As spot rises, a short call’s delta grows more negative, so staying hedged means buying — and buying more the further it runs. As spot falls, they must sell. Short-gamma hedging chases price, which adds fuel to a move.
Whoever is long options is long gamma. Their hedge works the other way: they sell into strength and buy weakness, because delta moves in their favour. Long-gamma hedging leans against price, which absorbs moves.
Aggregate that across every strike on the board and you have gamma exposure.
What gamma exposure actually measures
For each strike, gamma exposure multiplies open interest by the option’s gamma and scales the result to a standard move. OIData expresses it as ₹ crore of hedging per 1% move in the index — which turns an abstract greek into a concrete question: how many crores have to change hands if NIFTY moves one percent?
Two numbers come out of the chain:
- Call GEX — gamma sitting on the call side.
- Put GEX — gamma sitting on the put side.
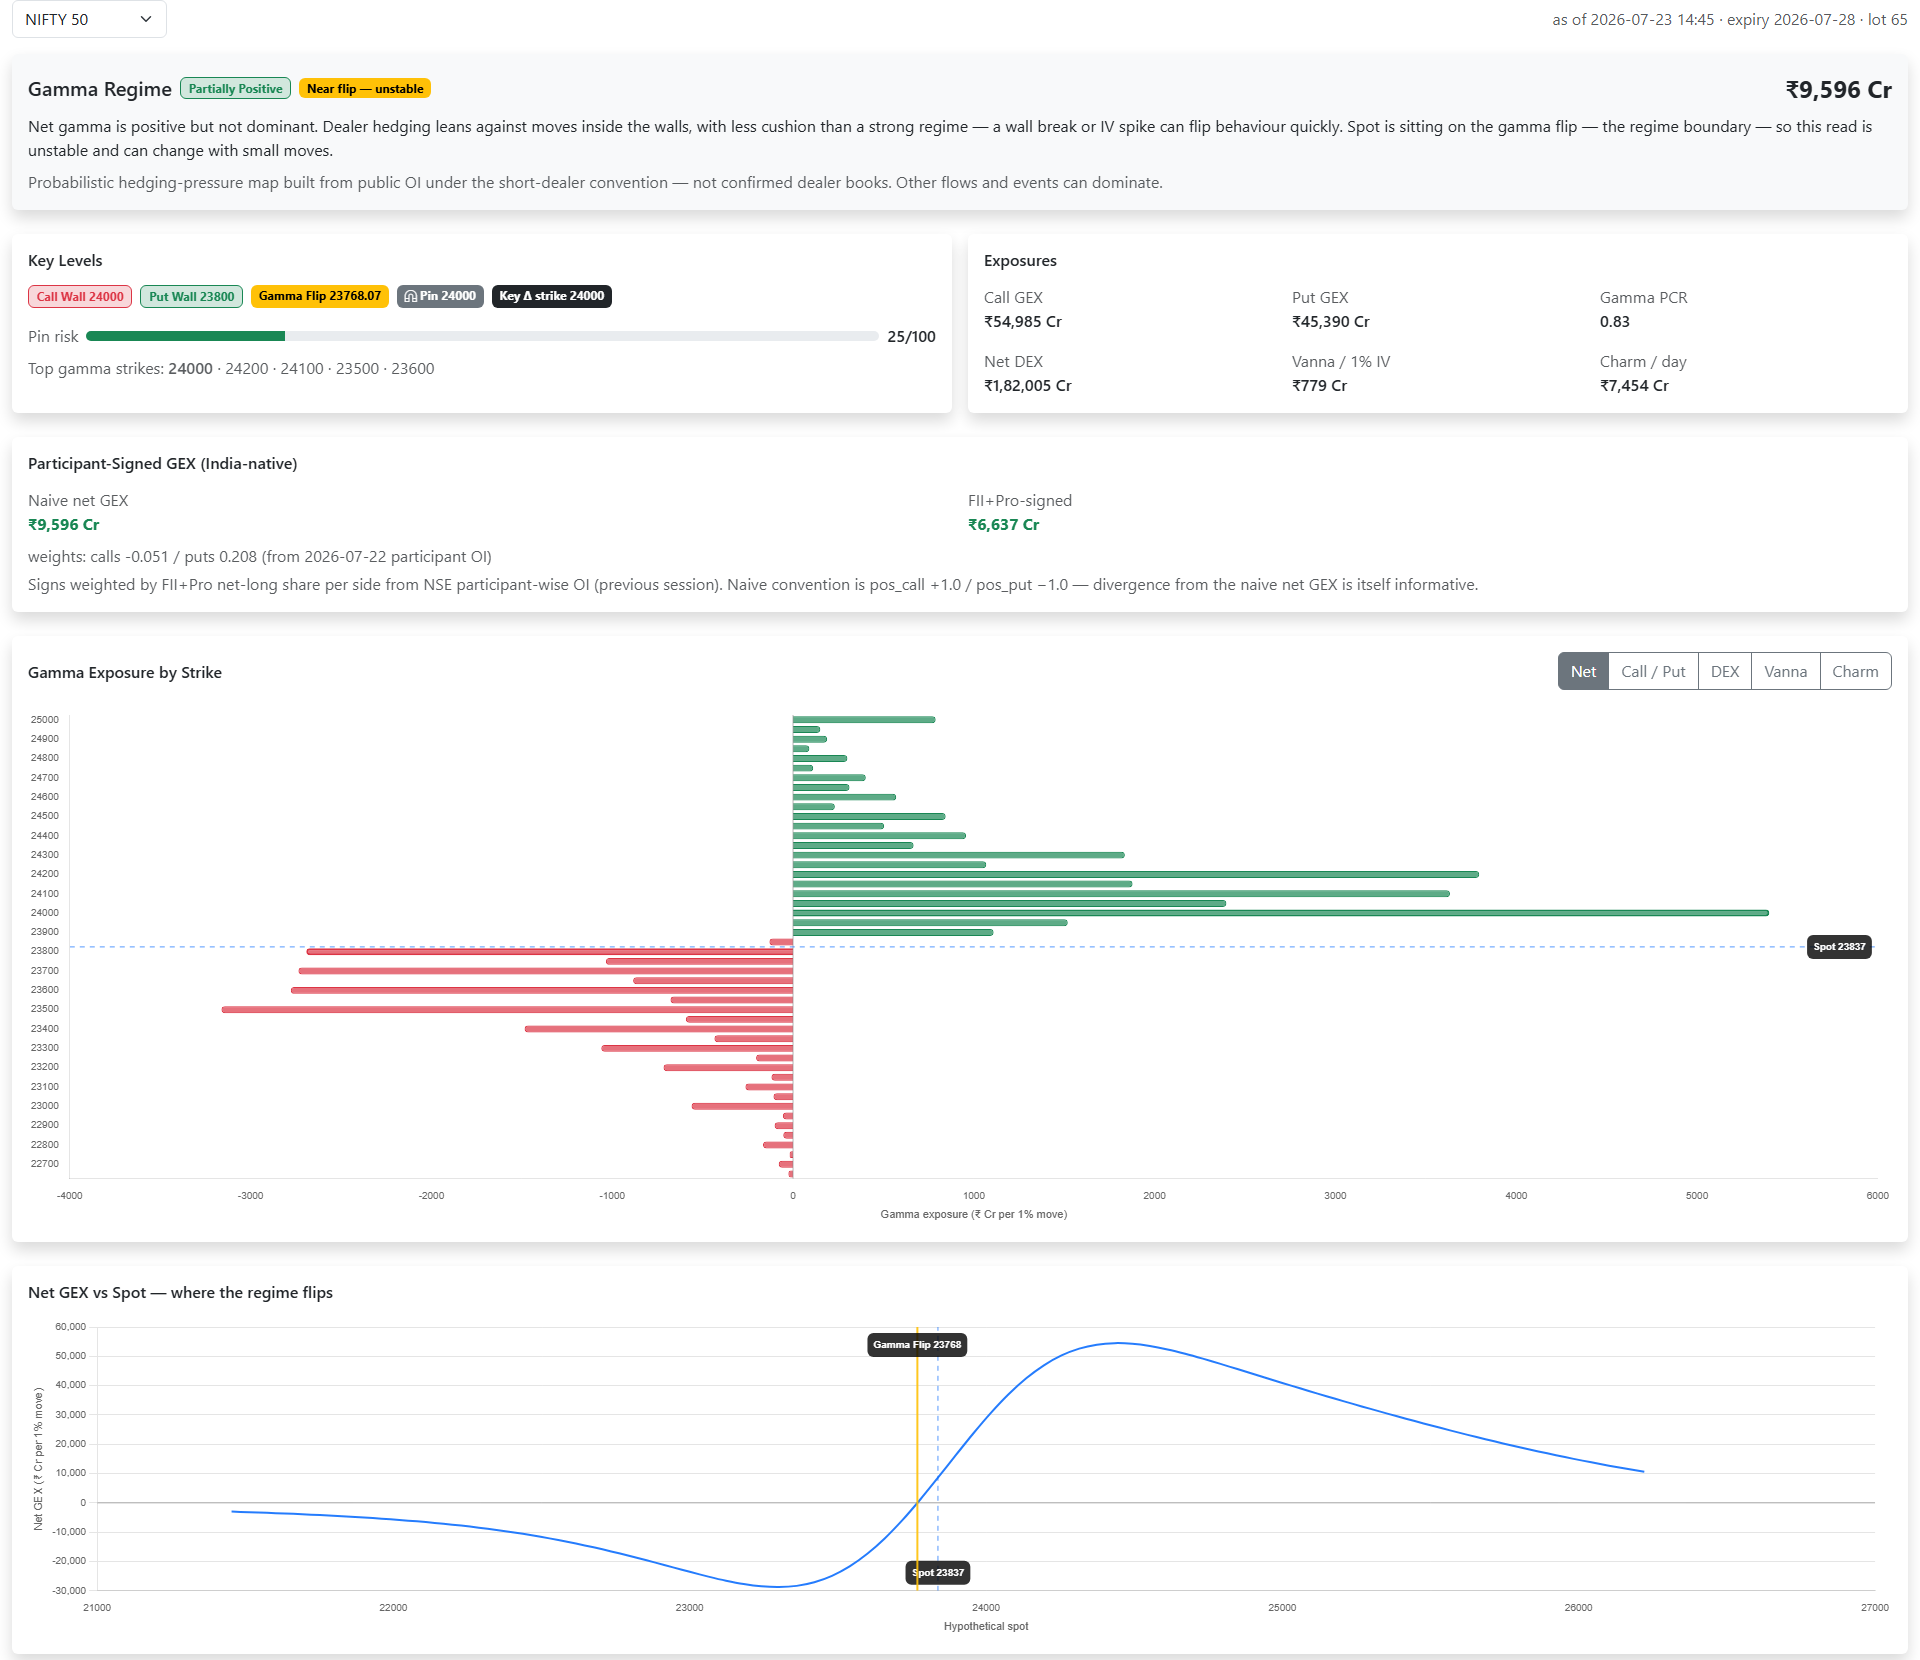
Net gamma exposure is the difference between them. The convention counts call gamma positive and put gamma negative, so in the screenshot above ₹54,865 Cr of call GEX against ₹52,985 Cr of put GEX nets to ₹1,880 Cr positive.
That sign convention is an assumption, not a measurement. More on that below — OIData gives you a way to test it rather than trusting it.
Positive vs negative gamma exposure
This is the part that changes how you trade the day.
Positive net gamma exposure — hedging leans against moves. Rallies get sold into, dips get bought, and realised volatility comes in below what options are pricing. Ranges hold. Breakouts fail more often than they work, and selling premium is the friendlier side.
Negative net gamma exposure — hedging chases moves. A push higher forces more buying, which pushes it higher still. Moves extend, gaps don’t fill, and stops get run. Trend following works here; mean reversion gets hurt.
OIData labels this directly as a Gamma Regime — strongly positive, partially positive, partially negative or strongly negative — with the plain-English read attached. Strength comes from net GEX as a share of gross exposure, so it reads the same way across indices; anything past 0.35 counts as “strongly”. In the screenshot the regime is Partially Positive at ₹1,880 Cr against nearly ₹108,000 Cr of gross gamma — technically positive, practically a rounding error, which is exactly what “partially” is telling you.
Reading the gamma exposure profile
The bar chart is where gamma exposure stops being one number and becomes a set of levels.
The call wall is the strike carrying the largest call-side gamma concentration — 24000 in the screenshot. Hedging around a heavy call strike tends to resist upward movement, so the call wall often behaves like a ceiling. The put wall is the mirror image, the largest put-side concentration at 23700, and tends to behave like a floor.
Between the two walls is where positive-gamma hedging does its dampening work. Outside them, that cushion is gone.
Pin risk scores how strongly spot is likely to be held near a strike into expiry — 34 out of 100 here, which is mild. High pin risk close to expiry is the structural version of the max pain tendency: no magnet, just hedging flows getting denser and more one-sided as time value drains away.
The top gamma strikes list — 24000, 23500, 23600, 24100, 23700 — is the shortlist of levels where hedging is thickest, ordered by size. Those are the prices where the tape is most likely to behave differently from the rest of the range.
Gamma walls are not the same as OI walls
This one trips people up, and OIData shows both, so it is worth being exact.
The OI walls on the Dashboard and in OI Stats are simply the strikes with the highest raw call and put open interest. The gamma walls on the Dealer Positioning page weight that same open interest by gamma.
They give different answers, and both are correct. Raw OI tends to flag round, far-out strikes where positional writers park size — 23000 and 25000 on the dashboard the same afternoon the gamma walls sat at 23700 and 24000. Gamma weighting pulls the walls in toward spot, because a strike only generates hedging flow if its delta is actually moving, and far-away strikes have next to no gamma.
So: read OI walls for where the big positional bets sit, and gamma walls for where today’s hedging actually bites. The raw-OI version of this read is covered in open interest support and resistance.
Beyond gamma: DEX, vanna and charm
The same chain re-cut by other greeks answers different questions, and the profile chart toggles between them.
- Net DEX (delta exposure) — ₹1,67,700 Cr in the screenshot — is the directional hedge already on the books. Big DEX means a lot of underlying has to move if that position unwinds.
- Vanna / 1% IV — ₹839 Cr — is how far the delta hedge shifts when implied volatility rises one percent relative, with spot unchanged. It is why a VIX spike alone can move the index without any news hitting the tape.
- Charm / day — ₹10,048 Cr — is how much delta bleeds away per calendar day purely from time passing. Charm is why expiry-week afternoons drift: hedges unwind on the clock rather than on the tape.
The convention problem — and participant-signed gamma exposure
Here is the honest limitation of every GEX model, this one included.
Gamma exposure is computed from public open interest. Open interest tells you a contract exists; it does not tell you who is long it and who is short. The standard patch is to assume dealers hold the calls customers sold and are short the puts customers bought — the +1 / −1 convention. It is a defensible average and it is wrong on plenty of individual days.
OIData tests it instead of hiding it. The Participant-Signed GEX card re-signs each side using FII and Pro net-long shares taken from NSE’s participant-wise open interest — actual positioning, published every evening. In the screenshot the naive convention gives ₹1,880 Cr while the participant-signed version gives ₹8,771 Cr: same direction, very different conviction.
When the two disagree in sign, the page flags it and the regime read should be treated as noise until they agree again. That divergence is itself the signal. The raw data behind it is covered in participant-wise open interest.
What gamma exposure will not tell you
- It is not dealer books. It is a hedging-pressure estimate from public OI under a stated convention, and the page says so on every payload.
- Events beat structure. A rate decision, a geopolitical headline, an index rebalance — real directional flow overwhelms hedging flow.
- It moves. The profile is recomputed through the session. A wall that held at 11am can be gone by 2pm if that strike unwinds.
- It needs greeks. Only strikes carrying exchange-published greeks contribute, so the profile thins out in the wings.
Treat gamma exposure the way you would treat knowing the tide: useful for deciding whether to expect chop or a run, useless for deciding which way.
On OIData
The Dealer Positioning page computes all of this live for NIFTY, BANKNIFTY and SENSEX — the regime read, both walls, pin risk, the flip level, the per-strike profile with DEX, vanna and charm toggles, and the participant-signed cross-check. For the same read across individual F&O stocks rather than the indices, use the GEX Screener.
Takeaways
- Gamma exposure estimates option-hedging pressure per strike, in ₹ crore per 1% index move.
- Positive net gamma exposure dampens moves and favours ranges; negative amplifies them and favours trends.
- The call wall acts as resistance and the put wall as support — both gamma-weighted, so they sit closer to spot than raw OI walls do.
- The sign convention is an assumption. The participant-signed number tests it, and disagreement means low confidence.
- Gamma exposure maps volatility behaviour, not direction.