Traditional support and resistance levels come from price history—old highs, old lows, and psychological round numbers. However, derivative markets give you a second, forward-looking source: the precise levels where institutional traders have placed their capital. Reading support and resistance off open interest is one of the most practical skills the option chain offers. By analyzing where major market participants have written options, retail traders can pinpoint where the market is likely to pause, reverse, or accelerate. Understanding open interest support and resistance is surprisingly intuitive once you grasp how option writers defend their positions. Let’s dive into how this powerful dynamic works on a daily basis in the Indian stock markets.
The core idea: writers defend support and resistance
Most large open interest at a strike is created by option writers (sellers), who profit when the option expires worthless. A writer is therefore motivated to defend their strike — they don’t want price to blow through it. That collective defence is what turns a heavily-written strike into a support or resistance level.
- Heavy call OI above the spot → resistance. Call writers there profit if price stays below the strike, so they lean against rallies into it.
- Heavy put OI below the spot → support. Put writers profit if price stays above the strike, so they cushion declines toward it.
If the concept of open interest itself is still fuzzy, start with What Is Open Interest? and then come back.
Why We Focus on Option Writers (Sellers)
To read these support and resistance levels well, look at who is on the other side of the trade. In the options market, option buyers have limited risk and unlimited reward, while option writers (sellers) face unlimited risk for a limited reward (the premium). Because writing options requires significant margin—often over ₹1 lakh per lot in the Indian market—it is primarily dominated by institutional investors, proprietary desks, and high-net-worth individuals (HNIs). These players do not block huge sums of capital without deep conviction and extensive research. That asymmetric risk-reward is why option-writing data makes these support and resistance levels meaningful: the big money is actively defending its premium. Understanding the difference between Open Interest vs Volume is critical here, as high volume without rising open interest indicates day-trading noise rather than strong institutional support or resistance.
Step one: find the OI walls
Open the chain for your expiry and look for the strikes with the largest open interest. To locate these zones, focus on two numbers:
- The strike with the highest call OI is the nearest meaningful ceiling (resistance).
- The strike with the highest put OI is the nearest meaningful floor (support).
Those two strikes frame the range the market is currently positioned for. Price spends much of its time between the biggest put wall and the biggest call wall.
Step two: read change-in-OI to see walls build or crumble
A big OI total can be old. The live information is in change in OI — today’s additions and reductions:
- Call OI rising at a strike above spot → resistance is being reinforced; sellers are defending it more heavily.
- Put OI rising at a strike below spot → support is being reinforced.
- OI falling at a wall → that level is being unwound; the defence is weakening and the level may give way.
Pair this with the option’s price to confirm whether rising OI is writing (defending the level) or buying (attacking it) — the same buying-vs-writing logic from OI buildup.
Step three: watch how price interacts with the wall
Levels are only as good as price’s respect for them:
- Rejection. Price approaches the high-call-OI strike, stalls and turns back → resistance is holding.
- Absorption then break. Price grinds at the wall while its OI falls (writers covering) → the level is being eaten through; a break becomes likely.
- Break and accelerate. When price decisively clears a heavily-written strike, the writers who were short that strike often have to hedge by trading in the breakout direction, which can accelerate the move. This is why breaks of major OI walls can be sharp — the defenders become buyers (or sellers) themselves.
Advanced: Fakeouts vs. Real Breakouts
One of the biggest traps retail traders face is trading a breakout that immediately reverses. So how do you separate a true breakout from a trap?
The secret lies in the volume and the unwinding of contracts. If Nifty rises above a major call writing wall (say, 22,300) but the call writers do not panic (meaning the change in OI at that strike remains flat or even increases), the breakout is likely a fakeout. Smart money is holding its ground, expecting the price to reverse. However, if price breaks the level and you simultaneously see a massive drop in OI at that strike—representing short covering—it is a confirmed breakout. The defenders have surrendered, and their forced buying will fuel the rally. You can study this in detail using tools like the Put-Call Ratio (PCR) to gauge the overall market sentiment before taking a trade.
A practical support and resistance example
Suppose NIFTY is near 22,150 and the chain shows:
- Highest call OI at 22,300 (and rising) → resistance overhead.
- Highest put OI at 22,000 (and rising) → support below.
The read: the market is positioned for a 22,000–22,300 range, with both walls being defended. A push to 22,300 that stalls confirms resistance; a close above 22,300 with that call OI unwinding signals the range has broken and the next leg up may be quick. The mirror applies at 22,000 on the downside.
Live Tracking on NSE India
Option trading in India is highly dynamic, especially during weekly expiries for Nifty and Bank Nifty. Traders can monitor these shifting dynamics directly on the NSE India official website, which provides live updates to the option chain. Since the Indian market is heavily influenced by domestic institutional flows, watching new walls form between 10:00 am and 2:00 pm often tells you where the afternoon session will be fought.
Combine OI support and resistance with classic price levels
OI walls are strongest when they line up with levels price already respects — a prior swing high or low, a round number (like 22,000 on NIFTY), or a previous breakout point. When the highest call OI sits right at an old resistance high, that confluence makes the level far more reliable than either signal alone. An OI wall floating in empty space, with no price-based level nearby, is easier to break.
Mind which expiry you’re reading
The walls that matter for an intraday or this-week view come from the nearest expiry, where most of the relevant OI sits. For a positional view, read the monthly expiry’s OI instead. Don’t mix them — a strike can look heavily defended in one expiry and almost irrelevant in another.
Caveats
- Levels shift with the chain. OI changes daily, so re-read the walls each session rather than anchoring to last week’s levels.
- Expiry compresses everything. Into expiry, OI drains across the board and these levels lose meaning for the expiring series — switch your attention to the next expiry.
- Confluence beats a single source. OI levels are strongest when they line up with classic price-based support/resistance (prior highs/lows, round numbers).
- It’s probabilistic. A wall is where defence is likely, not a force field. Always manage risk around it.
On OIData
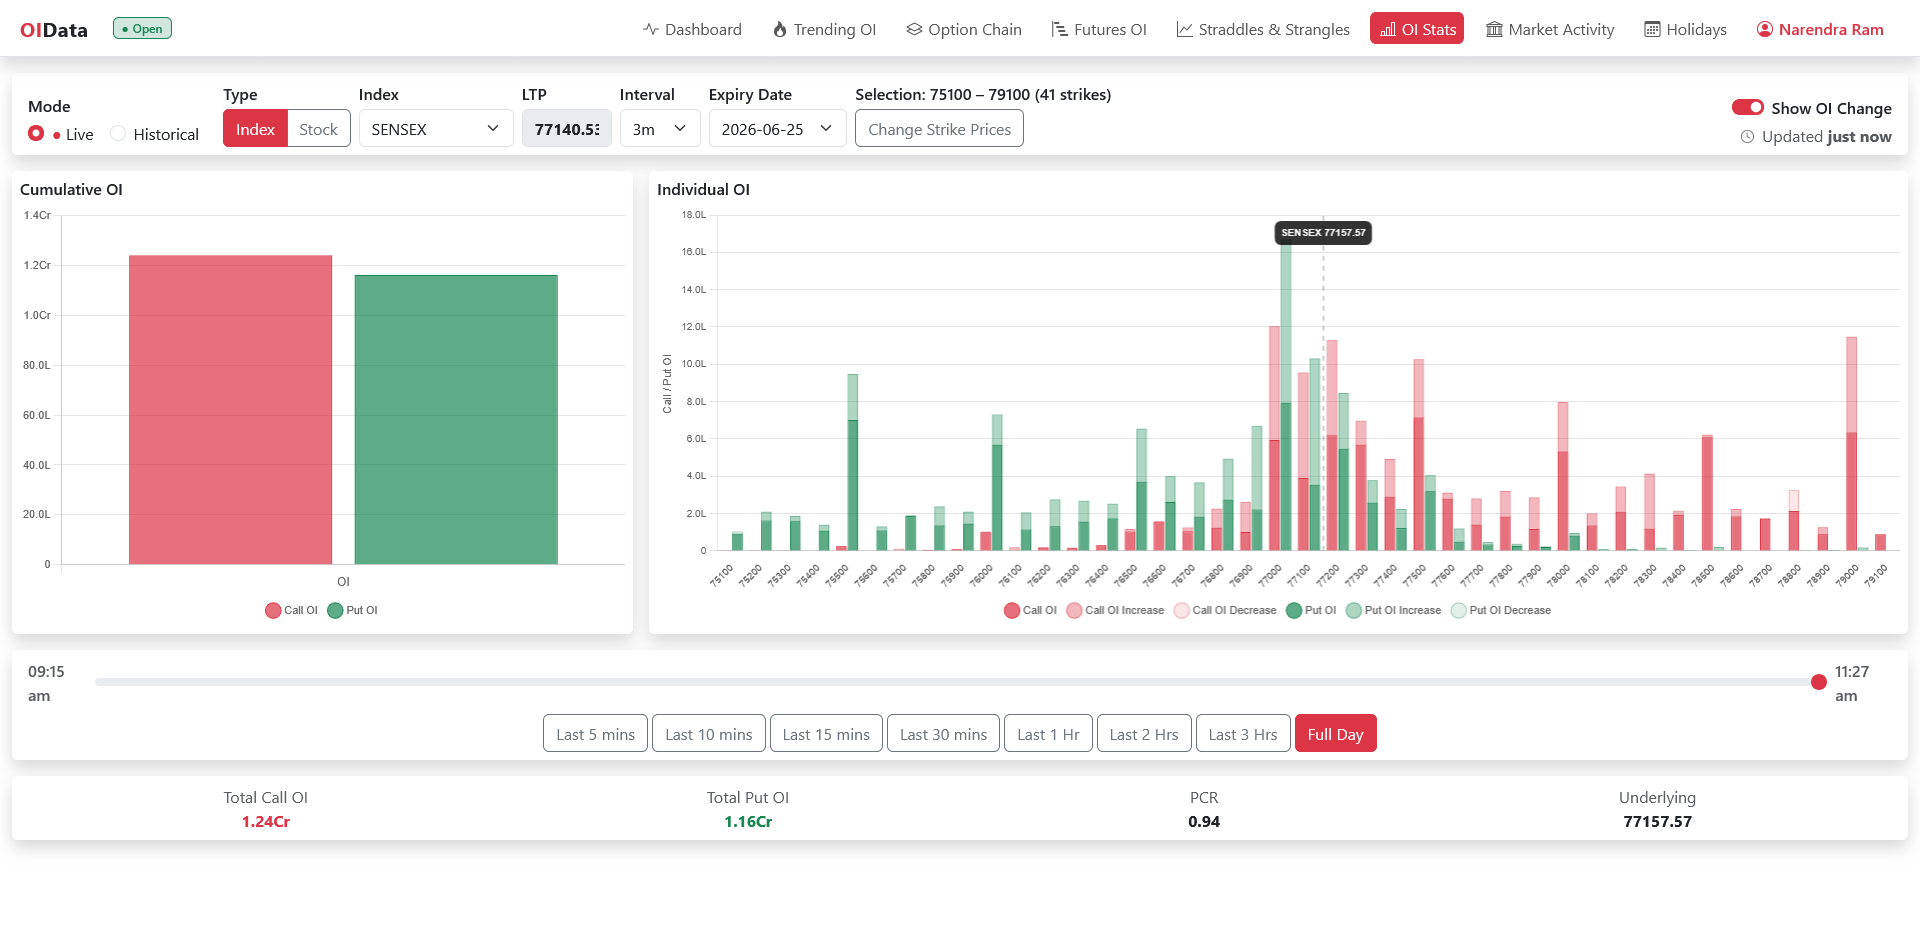
The Option Chain page surfaces OI and change-in-OI per strike so the walls are easy to spot, and Trending OI highlights where positioning is shifting fastest — which is exactly where support and resistance are forming or breaking.
Related reading
Weighting those same strikes by gamma pulls support and resistance closer to spot — see gamma exposure explained — and a support and resistance wall relocating or unwinding can be delivered to you as an open interest alert.
Takeaways
- Big option OI marks levels writers defend: heavy call OI above = resistance, heavy put OI below = support.
- Find the highest call and put OI strikes to frame the expected range.
- Use change-in-OI to see walls strengthen or unwind, and watch price to confirm a hold or a break.
- Breaks of major OI walls can accelerate as defenders are forced to hedge — respect them, and re-read the levels every day.
- Reading these levels lets you look past a lagging price chart and see where capital is actually committed.