India VIX is one number, and one number cannot describe a market’s volatility. It says how much movement the options market expects over the next month, and nothing about how that expectation is spread across expiries, across strikes, or against what the market has actually been delivering. The volatility surface answers those questions, and its two most readable slices are the IV term structure, which is implied volatility by expiry, and the skew, which is implied volatility by strike. This guide explains how to read both, along with the volatility risk premium and the implied distribution, and what the shapes have meant on NIFTY and BANKNIFTY.
What the IV term structure is
Take the at-the-money implied volatility of each expiry, nearest first, and plot them in order. That line is the term structure. In a calm market it slopes upward: the nearest expiry carries the lowest IV and each later expiry a little more, because the further out you look the more unknowns there are to price. That shape is called contango, and it is the default. The opposite shape, where the nearest expiry carries the highest IV and the curve falls away, is backwardation, and it means the market is pricing more turbulence in the next few sessions than in the months beyond. The slope, the difference between the near and far points, is a single number that summarises the shape.
Implied volatility itself is the input to all of this; if the term is new, the implied volatility guide covers what an IV of 12% means and how it turns into rupees of premium.
Why the shape matters
Backwardation is the term structure worth respecting. It appears when something specific sits inside the nearest expiry: a budget, a policy decision, a results week, an election count. The market pays up for the expiry that contains the event and not for the ones after it, so the curve inverts. When the event passes, the near-term IV collapses and the curve normalises, which is why selling the front expiry into an event feels rewarding right up to the day it is not. Contango tells a quieter story: no concentrated risk, the usual drift of uncertainty with time. A term structure that is flattening from contango towards inverted is the early warning, and it usually flattens before the news arrives, because the people positioning for the event are the ones moving the near expiry.
For strategy, the term structure decides where the volatility is being sold. A steep contango makes far-dated options relatively dear and near-dated ones relatively cheap; backwardation reverses that. Calendar spreads, and the choice of expiry for a straddle or strangle, start from this curve.
The volatility risk premium
Implied volatility is what options price; realized volatility is what the index actually did. The volatility risk premium is the gap between them, India VIX minus the realized volatility of the last 30 sessions. A positive premium is the normal state: options price more movement than the market tends to deliver, which is why systematic option selling has an edge on average and why that edge disappears in exactly the weeks it is needed most. A thin or negative premium means realized turbulence has overtaken what options imply; the market is under-pricing risk, or has just been surprised. Ranking today’s premium against its own recent history, as a percentile, keeps expensive and cheap relative to the market’s own normal rather than to a fixed number.
The 25-delta skew
The term structure reads IV across time; the skew reads it across strikes. Compare the implied volatility of a 25-delta put with a 25-delta call of the same expiry, two options roughly equally far from spot on either side. The difference is the risk reversal, written RR25. When puts carry the higher IV, the market is paying more for downside protection than for upside participation, which is the usual state in an equity index, and a widening gap is hedging demand building. When calls carry the higher IV, the crowd is chasing upside, which is rarer and worth noticing. A companion number, the 25-delta butterfly, measures how much both wings cost relative to the at-the-money option, the curvature of the smile. The strike distribution that option prices imply, and the expected daily move that comes with it, are the other side of the same coin, covered in the expected move guide.
The surface as one grid
Put the two slices together and you have the surface: strikes as a percentage from spot across, expiries down, each cell an implied volatility, darker where options are dearer. The ridge on the put side of the grid is the price of downside protection, and watching it steepen before an event and flatten after is the clearest picture of hedging demand there is. Reading the surface is mostly reading its two edges, the term structure down the at-the-money column and the skew along each expiry’s row.
A worked reading
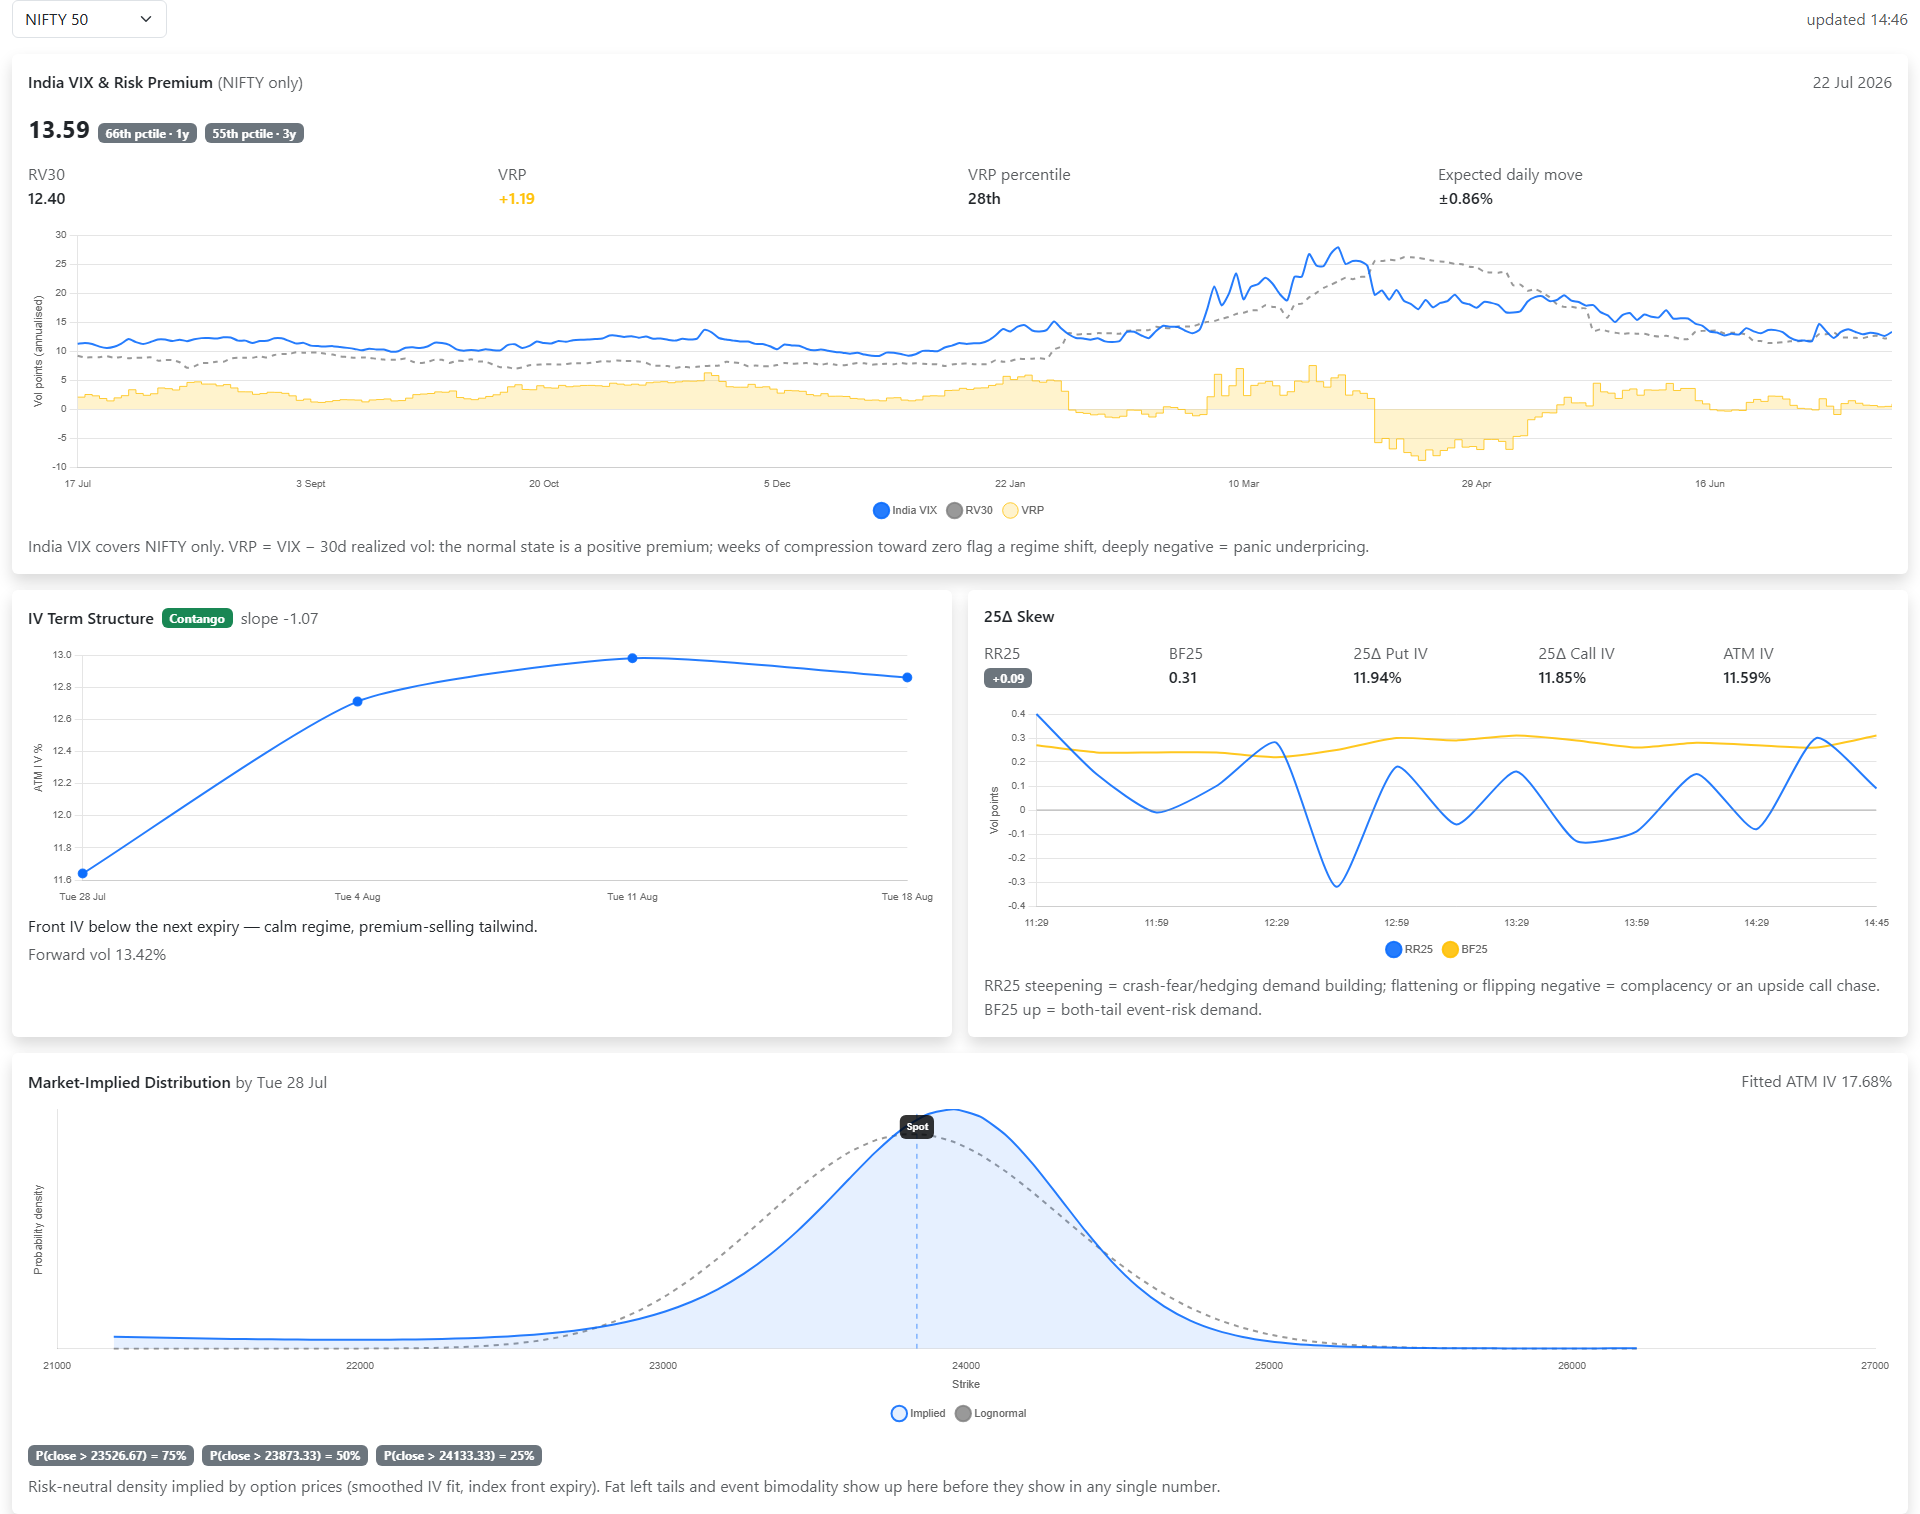
On 28 August 2026, the day in the figure, India VIX stood at 11.19, in the 24th percentile of its last year and the 15th of the last three, a low level by recent standards. Realized volatility over 30 sessions was 8.66, so the premium was +2.53 volatility points, ranked in the 62nd percentile: implied above delivered, as usual, and by a fairly typical margin. The term structure panel is the one that stands out. It is labelled backwardation, with at-the-money IV at 12.2% for the nearest expiry falling to about 9.5% for the ones beyond, a slope of 2.49 points between the near and far ends: the market was pricing the next few sessions as materially more eventful than the months after them. The skew panel shows RR25 at −5.20, with the 25-delta call IV at 18.16% against 12.96% for the put. Calls were dearer than puts, an upside chase rather than a downside hedge. Put together: a low VIX, a normal premium, a near-term event priced into the front expiry, and a crowd paying up for calls. Each panel alone is a fact; together they are a description of the day.
Where to see it
The Volatility page assembles this picture for NIFTY, BANKNIFTY and SENSEX from live option prices, refreshed through your own broker connection: India VIX against realized volatility with the premium and its percentile, the IV surface as a grid, the term structure with its regime label and slope, the 25-delta skew with RR25 and BF25, and the implied distribution with the expected daily move. India VIX itself covers NIFTY only; the surface, term structure and skew panels are computed for each index from its own chain. For the dealer side of the same options, the gamma profile and its walls, see the gamma exposure guide.
Term structure FAQ
What is the IV term structure? At-the-money implied volatility plotted across expiries. An upward slope (contango) is normal; an inverted curve (backwardation) means near-term stress is being priced above the future.
What is the volatility risk premium? India VIX minus the realized volatility of the last 30 sessions. Positive is the usual state; negative means the market has been moving more than options implied.
What is 25-delta skew? The IV of a 25-delta put minus the IV of a 25-delta call. Positive means puts are dearer, the market paying for crash protection; negative means calls are dearer.
Where does India VIX come from? The NSE computes it from NIFTY option prices; the NSE’s India VIX page describes the method.
Takeaways
- The term structure is IV by expiry. Contango is the calm default; backwardation means an event is priced into the front.
- The premium between implied and realized volatility is usually positive; watch it thin or turn negative.
- The 25-delta skew is IV by strike: dear puts are hedging demand, dear calls an upside chase.
- The surface is both at once; read its two edges.
- Read the panels together. One is a fact, four are a description of the day.