Two traders look at the same NIFTY option and one calls it “cheap” while the other calls it “expensive.” How? They are judging its implied volatility. Understanding implied volatility is what separates traders who understand option pricing from those who only guess direction. When you grasp this core element, a lot of confusing option pricing behavior in the Indian derivatives market suddenly makes sense. Instead of simply looking at stock prices, professional derivatives traders focus deeply on how volatility expectations shape premium pricing. Knowing how this mechanism works will immediately elevate your execution, whether you trade weekly NIFTY options or monthly stock contracts.
What implied volatility actually measures
Implied volatility (IV) is the market’s expectation of how much the underlying will move in the future, expressed as an annualised percentage and implied by the option’s price. Run an option’s market premium backwards through a pricing model and the volatility figure that makes the model agree with the market is the IV.
The key relationship is simple:
- Higher IV → higher premiums (both calls and puts get more expensive).
- Lower IV → cheaper premiums.
IV doesn’t tell you direction — it tells you the size of move the market is pricing in. A high-IV option isn’t bullish or bearish; it’s just expensive because big moves are expected.
IV vs realised volatility
- Implied volatility is forward-looking — the market’s forecast.
- Realised (or historical) volatility is backward-looking — how much price actually moved.
Comparing IV against realised volatility is the crucial next step. When IV sits well above what the stock typically realises, options are richly priced (good for sellers). When implied volatility is unusually low versus realised, options are cheap (better for buyers). Much of professional options trading is really a bet on the gap between implied and realised volatility. If you want to dive deeper into how market participants position themselves during these volatility shifts, you can read our guide on Pro vs Client Positioning.
India VIX: the market’s fear gauge
India VIX is the National Stock Exchange’s volatility index — a measure of the expected near-term volatility of the NIFTY, derived from its option prices. You can check the real-time VIX movements directly on the official NSE India website. Think of it as aggregate IV for the index:
- Rising VIX → traders expect bigger moves; fear/uncertainty is rising. Option premiums swell.
- Falling VIX → calm, complacency; premiums deflate.
VIX typically spikes during sharp sell-offs and around big events, then subsides. Watching it tells you whether the environment favours buying or selling options. For broader context, combining VIX analysis with the Put-Call Ratio (PCR) provides a highly reliable picture of market sentiment.
What drives IV up and down
Several market factors drive IV up or down:
- Events. IV climbs ahead of known catalysts — company results, the Union Budget, RBI policy, election outcomes — because a big move is possible. After the event, IV usually collapses.
- Fear and shocks. Sudden sell-offs send IV (and VIX) higher as demand for protection jumps.
- Calm trends. Quiet, grinding markets bleed IV lower.
- Supply and demand for options themselves — heavy hedging demand lifts IV regardless of realised movement.
Understanding these macro forces is easier when you monitor institutional activity. Tracking FII & DII data can often clue you in on when institutional players are buying protection, which drives up IV across the board.
IV Rank (IVR) and IV Percentile (IVP): Relative Volatility
To use IV in a trade you first need to know whether it is high or low relative to its own history. An absolute IV number of 30% might look high for NIFTY, but for a highly volatile stock like Tata Motors, it could be dirt cheap. This is where IV Rank (IVR) and IV Percentile (IVP) come in.
- IV Rank (IVR) measures where the current IV lies relative to its 52-week high and low. It is calculated as:
IV Rank = (Current IV - 52-Week Low) / (52-Week High - 52-Week Low) * 100
An IV Rank of 90 means the current implied volatility is almost at its yearly peak, making it an ideal environment for option sellers. - IV Percentile (IVP) measures the percentage of days over the past year that the IV traded below the current level. If IVP is 80%, it means the IV was lower than its current value on 80% of trading days.
Analyzing these metrics alongside open interest support and resistance levels helps you determine whether writing premium or buying options has a higher statistical edge.
Option Greeks: The Role of Vega
To master option pricing, you must understand the Greeks. Vega measures how much an option’s price moves for a one-point change in implied volatility. Specifically, Vega tells you how much the premium of an option will change for every 1% change in IV.
For example, if a NIFTY Call option has a premium of ₹150, an IV of 16%, and a Vega of 15: - If IV increases to 17% (a 1% rise), the option premium rises by ₹15 to ₹165. - If IV drops to 15% (a 1% drop), the option premium falls by ₹15 to ₹135.
Both call and put buyers benefit from rising Vega (expanding IV), while option sellers benefit from contracting Vega (collapsing IV). This highlights why tracking the overall OI Buildup is critical; when large institutions accumulate massive short positions during high IV regimes, they are betting heavily on Vega decay to pocket the premiums.
IV crush: the trap for option buyers
Here’s where beginners lose money even when they’re right about direction. Before a known event, IV is elevated, so options are expensive. The moment the event passes, the uncertainty is resolved and IV crashes — this is IV crush. A long option can lose value even if the underlying moves your way, because the volatility premium you paid for evaporated.
The lesson: buying options into an event means buying inflated IV. The underlying has to move more than the priced-in expectation just to break even. Always check whether IV is already high before buying. This phenomenon often plays out dramatically around expiry days, closely aligning with the Max Pain Theory.
How to use IV in practice
- Read the IV column on the chain. Compare strikes and expiries; note whether IV is high or low versus the instrument’s own recent range. The how to read the option chain guide shows where to look.
- Buy low IV, sell high IV — broadly. Long options favour low IV (cheap, room to expand); writing favours high IV (rich premium, room to contract). This is the core of premium-selling strategies.
- Respect events. If IV is elevated before results, a long option needs a big move to overcome the coming IV crush.
- Watch VIX for context. It frames whether the whole environment is cheap or expensive for option buyers.
Caveats
- IV is a market expectation, not a forecast that has to come true.
- Do not treat implied volatility as a directional signal.
- It’s only as good as the pricing model’s assumptions; deep OTM strikes can show quirky IV (volatility “skew”).
- IV is about magnitude, never direction — pair it with your directional read, with open interest, with a structured futures open interest analysis, and with open interest vs volume analysis.
On OIData
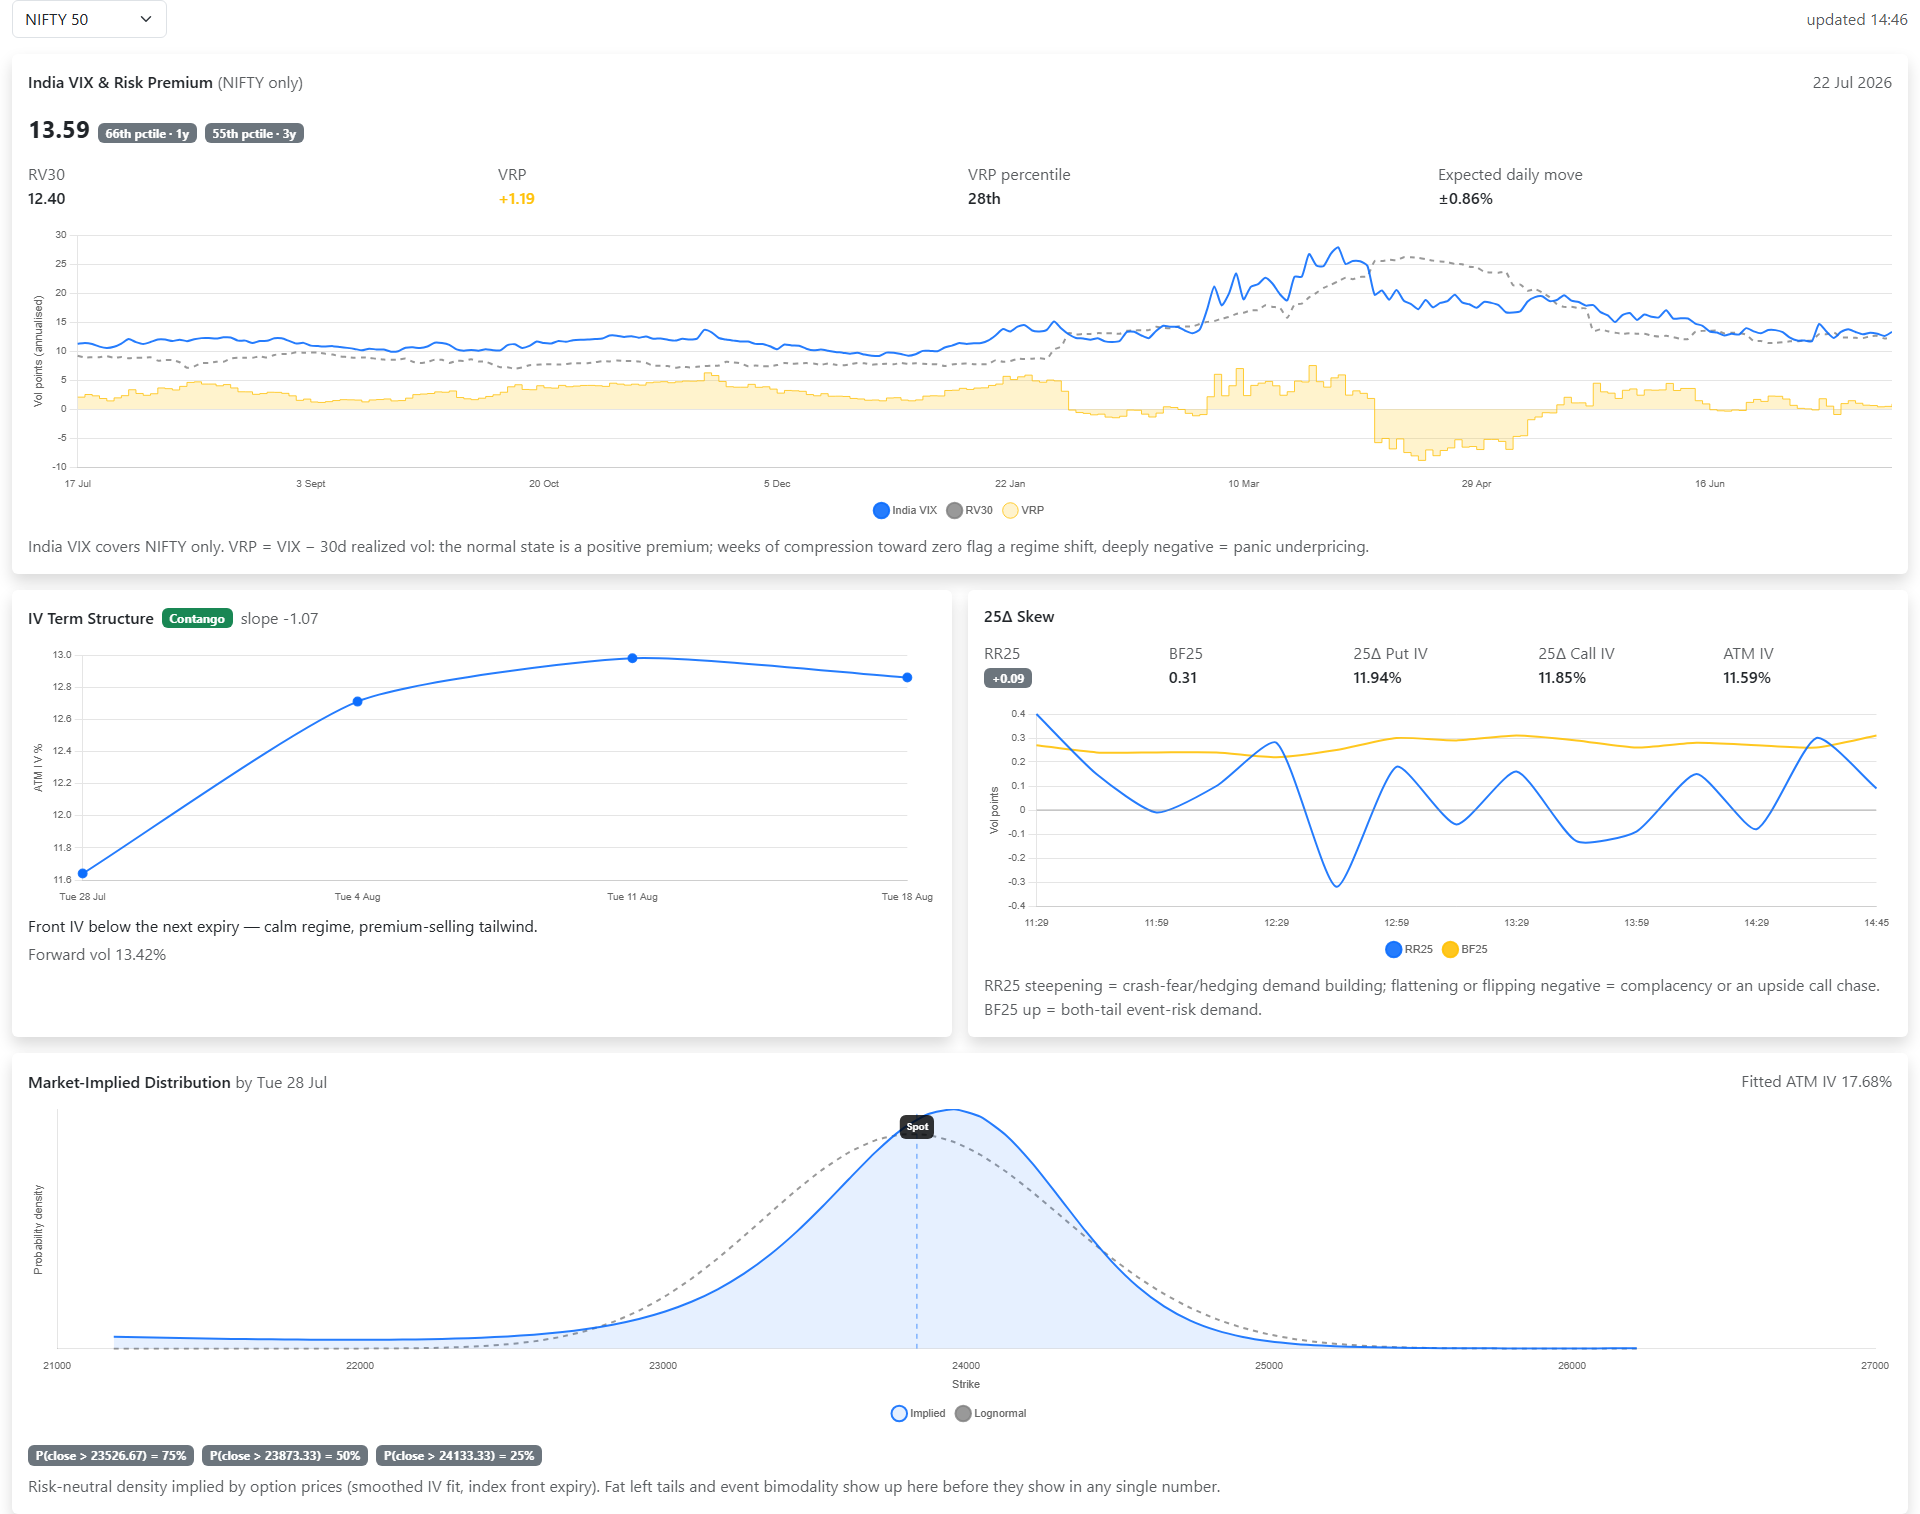
The Volatility page is built for exactly this read — India VIX with its 1-year and 3-year percentile, 30-day realised volatility, the variance risk premium, the IV term structure and 25-delta skew. The Option Chain shows IV per strike so you can see where volatility is being priced richest, and the Dashboard keeps the broader volatility backdrop in view alongside positioning.
Related reading
What the options market implies about distance is covered in expected move, and how volatility feeds a broader sentiment read in the Market Mood Index.
Takeaways
- IV = the market’s expectation of future movement, implied by option prices; higher IV = pricier options.
- Unlike historical volatility, implied volatility is a forward-looking expectation.
- Reading IV in context is how you tell whether options are cheap or expensive.
- It measures size of move, not direction.
- India VIX is aggregate index IV — a fear/calm gauge.
- Beware IV crush: buying inflated IV before an event can lose money even when you’re right on direction. Broadly, buy low IV, sell high IV.