Everybody agrees that markets swing between fear and greed. The hard part is saying how much, today, without simply reading your own positions back to yourself. The market mood index on OIData is an attempt at that: a single 0–100 score for Indian market sentiment, built from seven measurable inputs rather than opinion.
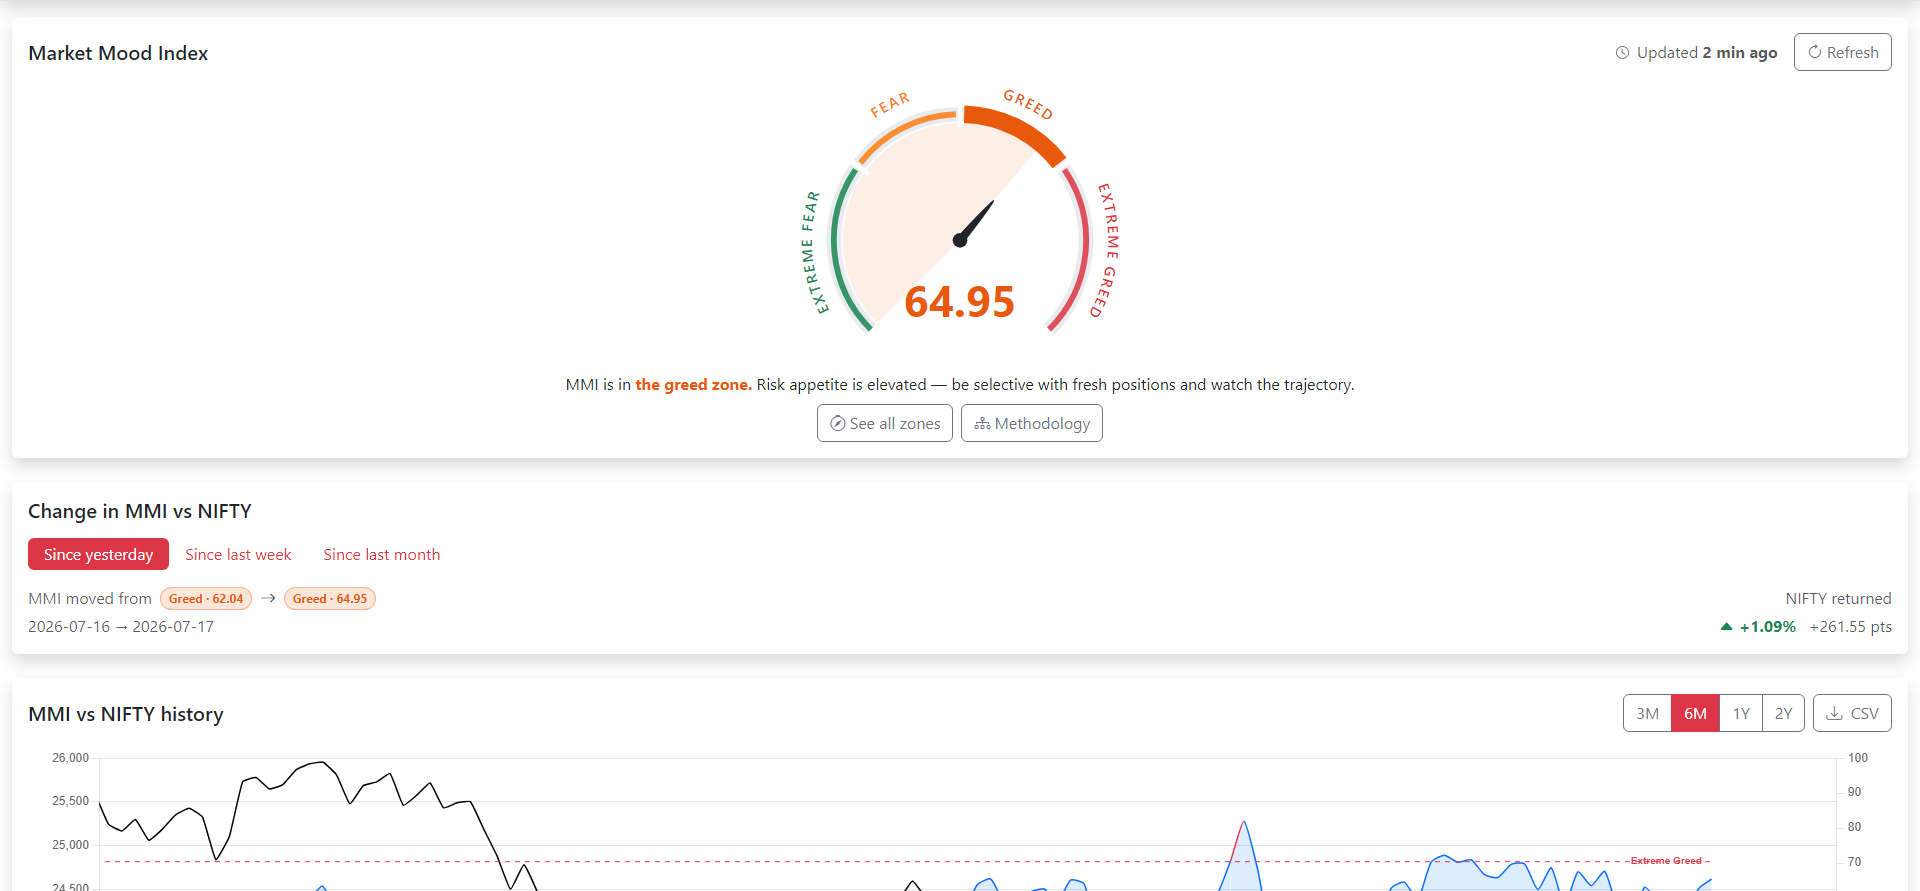
The number in the screenshot is 37.13 — the fear zone. What makes it useful is not the number itself but the fact that every component behind it is inspectable, and that the whole thing is normalised against its own history rather than against arbitrary thresholds.
What the market mood index measures
Seven inputs, equally weighted, each scored 0–100 with greed always pointing up:
| Input | What it reads | Direction |
|---|---|---|
| FII activity | Net open interest of foreign institutions in NSE index futures | more net long → greed |
| Volatility | India VIX, the market’s price for 30-day expected volatility | higher → fear |
| Skew | Extra implied volatility paid for OTM Nifty puts over calls | pricier puts → fear |
| Momentum | Nifty’s 30-day EMA against its 90-day EMA | above trend → greed |
| Breadth | Modified Arms Index (TRIN) across the Nifty 500 | lower TRIN → greed |
| Price strength | Fresh 52-week highs minus fresh 52-week lows, Nifty 500 | more highs → greed |
| Gold demand | Gold’s two-week return versus Nifty’s, via GOLDBEES | gold winning → fear |
Those seven are doing genuinely different jobs. FII positioning is what large money has actually done. VIX and skew are what the options market is charging for protection. Momentum and breadth are what price is doing. Gold is the flight-to-safety tell. A reading only reaches an extreme when several of those agree, which is the point of averaging them.
How the market mood index is normalised
This is the part that separates a real sentiment gauge from a dressed-up VIX chart.
Each input is z-scored against its own trailing 45-session mean and standard deviation, then mapped onto 0–100. So the question is never “is VIX high?” in the abstract — it is “is VIX high relative to where it has been for the last nine weeks?” A VIX of 14 can be a fear reading in a calm regime and a greed reading after a crisis, and z-scoring handles that automatically.
It also means components need history before they can contribute. A component with fewer than 15 sessions behind it shows “warming up” and sits out of the average rather than polluting it with a score it cannot justify.
The zones are fixed: below 30 extreme fear, 30–50 fear, 50–70 greed, above 70 extreme greed.
Reading it properly: level versus direction
The single most common mistake is treating the level as a signal on its own.
The app’s own copy on a fear reading is deliberately non-committal: “Investors are nervous; what to do next depends on which way the needle is travelling.” That is the whole lesson. An MMI of 37 falling from 47 — exactly the screenshot — is a market in the process of getting frightened. An MMI of 37 climbing from 22 is a market recovering from a scare. Same level, opposite situations.
That is why the page pins the change next to the level across three spans — since yesterday, since last week, since last month — and puts NIFTY’s return for the same span beside it. In the screenshot MMI dropped 10 points while NIFTY fell 0.43%, or 102 points. Sentiment moved considerably more than price did, which is itself worth knowing.
The MMI vs NIFTY history chart extends that over 3 months to 2 years, shading the extreme-fear and extreme-greed stretches. Looking at where those bands sat against subsequent price action is a far better education in the market mood index than any single day’s reading. The history is exportable as CSV if you want to test it yourself rather than take anyone’s word for it.
What it is not
It is not a timing tool. Extreme fear has historically been a better hunting ground for fresh positions than extreme greed, and that is a tilt in the odds, not a trigger. Markets can stay in extreme fear for weeks and keep falling.
It is not the India VIX with extra steps. India VIX measures exactly one thing: the volatility priced into Nifty options for the next 30 days. It is one of seven inputs here. The market mood index will diverge from VIX whenever positioning, breadth or the flight to gold is saying something the option premium is not — and those divergences are usually the interesting days.
It is not a directional forecast. Sentiment describes how the market feels. Feeling frightened and going down are correlated, not identical.
It updates on a schedule. The official value is computed once per trading day, after NSE publishes the evening institutional data, because the FII component depends on it. During market hours the dial also carries a live provisional read from quotes and the option chain, marked as such — treat that as an early estimate, not the settled figure.
Using it with the rest of the data
The market mood index is a top-down summary, so it works best as the first thing you look at and never the last. A few pairings that hold up:
- Fear reading, and you want to know if it is priced. Cross-check implied volatility — if VIX is elevated but the variance risk premium says options are already expensive, the fear is in the price.
- Greed reading, and you want to know who is carrying it. The FII and DII flows show whether the optimism is foreign, domestic, or retail.
- Extremes, and you want a structural read. Check whether gamma exposure is positive or negative. Extreme fear in a negative-gamma regime is a very different risk profile from extreme fear in a positive-gamma one.
On OIData
The Market Mood page carries the live gauge, the component-by-component breakdown with each input’s raw value and score, the change-versus-NIFTY panel, the full history chart with CSV export, and the methodology in detail. A compact version rides along on the Dashboard so you see the mood without leaving the day’s other data.
Takeaways
- The market mood index scores Indian sentiment 0–100 from seven equally weighted inputs.
- Each input is z-scored against its own 45-session history, so readings adapt to the prevailing regime.
- Direction matters more than level — 37 falling and 37 rising are opposite situations.
- Zones: under 30 extreme fear, 30–50 fear, 50–70 greed, over 70 extreme greed.
- It measures how the market feels, not where it is going.