Every evening NSE publishes what foreign and domestic institutions did that day, and every morning somebody quotes one line of it as though it settled the question. Reading institutional activity properly means knowing which figure you are looking at, over what horizon, and what it cannot tell you. Open interest is where that story continues.
Every trading day after the close, two numbers make the headlines: how much the FIIs bought or sold, and how much the DIIs did. For Indian traders, checking the daily FII/DII figures is a standing ritual — these institutional activity drive a large share of daily turnover. Analyzing this institutional activity provides invaluable insights into market sentiment and trend sustainability. Here is what those figures actually mean, how to read them alongside derivatives metrics, and how to avoid overreacting to a single-day spike.
Who’s who
- FII / FPI — Foreign (Portfolio) Institutional Investors. Overseas funds, banks and asset managers investing in Indian markets. They tend to move in large, trend-setting waves and are sensitive to global cues — the dollar, US rates, risk appetite, currency moves.
- DII — Domestic Institutional Investors. Indian mutual funds, insurance companies, banks and pension funds. Their flows are heavily fed by steady domestic savings (think monthly SIP inflows into mutual funds), which makes them comparatively stickier.
How to interpret the daily figures
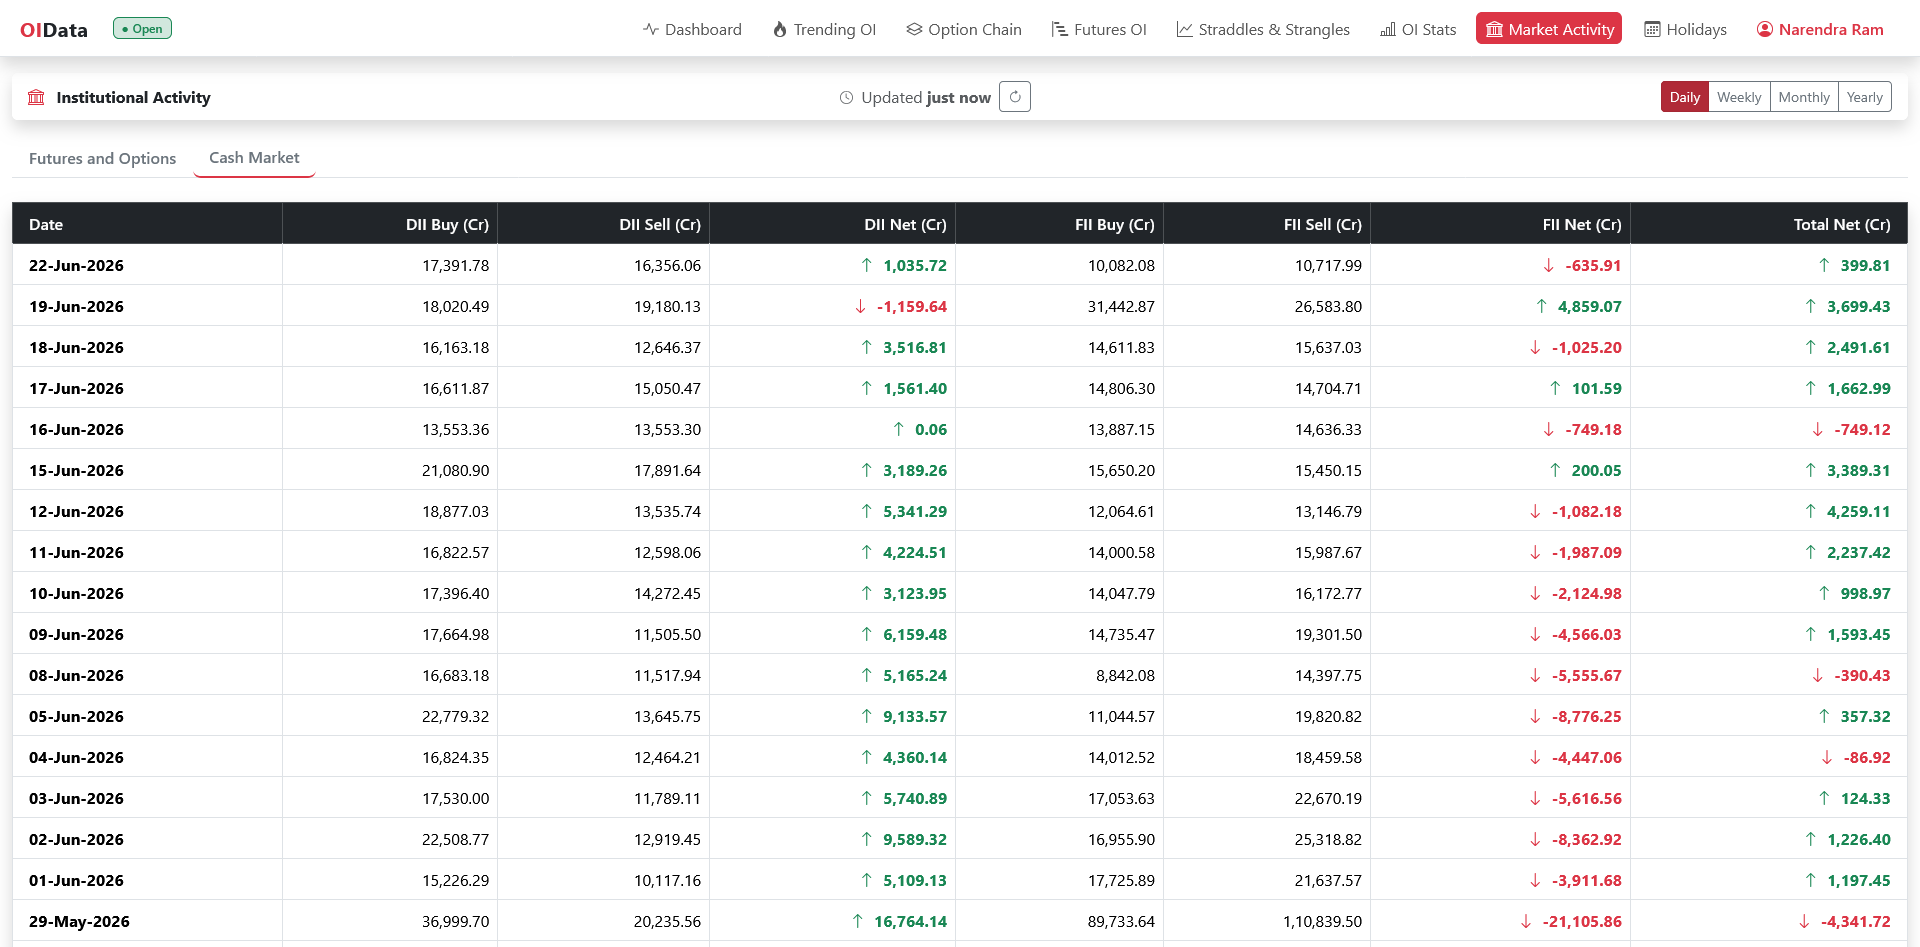
After the session, exchanges like NSE India publish provisional cash-market activity for FIIs and DIIs:
- Gross buy — total value bought (₹ crore).
- Gross sell — total value sold (₹ crore).
- Net — buy minus sell. Positive = net buyers; negative = net sellers.
A couple of important distinctions:
- Provisional vs final. The same-day numbers are provisional; the consolidated FPI figures (via the depositories) are released later and can differ. Don’t treat the provisional print as gospel.
- Cash vs derivatives. The headline FII/DII figure is the cash market. FIIs are also big in derivatives (index and stock futures/options), and that positioning shows up in the participant-wise F&O data — a different dataset covered in Pro vs Client positioning.
Why FII and DII flows often move in opposite directions
One of the most useful patterns: on many days, FIIs and DIIs are on opposite sides. When FIIs sell heavily, DIIs often absorb some of that selling (and vice versa). This tug-of-war is why a big FII sell day doesn’t always crater the index — domestic money can cushion it.
That gives you a quick interpretive lens:
- FIIs selling, DIIs buying: foreign money is exiting but domestic flows are absorbing. The market’s direction depends on who’s more aggressive.
- Both buying: broad-based demand — a strong tape.
- Both selling: few buyers stepping in — a weak, vulnerable tape.
What moves FII flows
FIIs allocate across dozens of markets, so their India decisions are often driven by global factors as much as local ones:
- The US dollar and US yields. When US rates rise or the dollar strengthens, emerging-market assets — India included — often see outflows as global money rotates toward safer, higher-yielding dollar assets.
- Global risk appetite. “Risk-on” phases tend to bring FII inflows; a “risk-off” shock can trigger broad emerging-market selling regardless of India’s own fundamentals.
- The rupee. A weakening rupee erodes FII dollar returns, which can accelerate selling — and heavy selling weakens the rupee further, a feedback loop worth watching.
- Valuations and events. Stretched valuations, the Union Budget, RBI policy and election outcomes all shift allocation decisions.
The practical lesson: an FII sell day can have little to do with Indian earnings — it may be a global rotation. Always ask whether a flow is India-specific or part of a broad emerging-market move.
How institutional activity shows up in F&O
While cash market flows are crucial, F&O traders must look beyond headline numbers. Institutional players use derivatives not just for speculation, but heavily for hedging. Read in isolation from the F&O segment, the cash figures paint an incomplete picture. For instance, an FII cash market selloff might look bearish at first glance. However, if the proprietary participant-wise F&O data shows they are simultaneously buying index call options or adding heavy long positions in index futures, it could indicate a tactical rotation or hedging activity rather than outright bearishness.
The FII net long-short ratio in index futures is the natural extension of the cash-market figures. When this ratio reaches extremes (e.g., FIIs being over 80% short or 80% long), the market often sets up for a sharp short-covering rally or a long-unwinding selloff. Seeing how those derivative positions line up with the cash flows keeps you off the wrong side of institutional momentum.
Combining institutional activity with other signals
To build a robust trading system, smart traders never rely on institutional activity alone. Instead they read the daily flows alongside derivative indicators, and act only when the two agree.
One effective approach is to cross-reference FII and DII buying or selling trends with the Put-Call Ratio (PCR). For example, if FIIs are net sellers in the cash market but the PCR is hovering in the oversold zone (below 0.70), it suggests that while institutional selling is keeping the tape heavy, a temporary bounce or short squeeze could be around the corner.
Similarly, combining daily flows with Open Interest Support and Resistance levels helps pinpoint high-probability reversal zones. If DIIs are buying heavily as NIFTY approaches a major put OI wall, that reinforces the support zone. Conversely, if FIIs are aggressively selling and the OI buildup indicates short buildup across major index heavyweights, traders should avoid catching a falling knife. Read alongside price action, the flows give you a fuller view of where the market is leaning.
A worked example
Say FIIs sell ₹4,000 crore in the cash market but DIIs buy ₹3,800 crore, and the index closes nearly flat. The read: foreign money is exiting, but domestic institutions are absorbing almost all of it — the market is being defended from within. If this pattern persists for weeks while the index holds, it points to resilient domestic demand. But if DII buying fades while FII selling continues, the cushion is gone and downside risk rises. That shift — not any single day’s figure — is the thing to watch for.
How to read institutional activity without overreacting
- One day is noise; the trend is signal. A single session means little. Watch the cumulative flow over weeks — sustained FII selling or buying is what shapes major moves.
- Context matters. FII selling during expiry, index rebalancing or a large block deal can be mechanical rather than a genuine change of view.
- It’s a backdrop, not a trigger. Institutional flow tells you the tide, not your entry. Combine it with price, levels and open interest before acting.
- Mind the currency. Sustained FII outflows often coincide with rupee weakness; the two reinforce each other and are worth watching together.
A simple daily routine
- Note the net FII and DII figures and whether they agree or offset.
- Check the multi-day trend — is FII selling accelerating or fading?
- Cross-reference with how the index actually closed — did domestic buying hold it up despite FII selling?
- Use it as context for your OI and price reads, not as a standalone signal.
On OIData
The Market Activity page tracks FII, DII, Pro and Client positioning so you can see institutional activity at a glance and follow the trend rather than reacting to a single day — and it sits alongside the Dashboard for a complete daily picture.
Related reading
FII positioning is one of the seven inputs behind the Market Mood Index, which turns institutional activity into one component of a sentiment score. For institutional activity broken down by Client, Pro, FII and DII rather than by cash flows, see participant-wise open interest.
Takeaways
- FIIs (foreign) are large and trend-setting; DIIs (domestic) are stickier, fed by steady savings.
- The daily print shows gross buy, gross sell and net in the cash market — and it’s provisional.
- FII and DII flows often offset each other, which is why a big FII sell day doesn’t always sink the index.
- Read the cumulative trend, treat it as context, and pair it with price and OI — never trade a single day’s number in isolation.
Open InterestOpen Interest