At 15:28 on Monday, 3 August 2026, the NIFTY 50 index jumped 200.95 points in a single tick. There was no rally behind it — the index had been frozen at 24,573.35 for thirteen minutes, and futures were trading as if nothing had happened. That tick was India’s first closing auction session print: the new mechanism that now sets the official closing price on NSE and BSE. If you trade Indian markets and have not changed how you read the close, the closing auction session should change it for you — because the official close and the traded market can now be two different numbers.
What the closing auction session changes
Until August 2026, the NSE closing price was a volume-weighted average of the last half hour of continuous trading — a summary of prices at which people actually traded. The closing auction session replaces that with a call auction, the same idea the market has always used at the open:
- 15:15 — continuous trading in the underlying stocks ends, and the index feed freezes. During auction order collection no indicative index value is disseminated, so every app, terminal and data feed simply holds the last continuous value.
- 15:15 to about 15:28 — closing orders are collected and matched into a single equilibrium price per stock. The reference window for price bands is the 15:00–15:15 VWAP.
- About 15:28 — the equilibrium becomes the official close, and index feeds reprint in one step. This is the “print”: not a trade you could have taken, but the auction’s output.
- 15:30 to 15:40 — equity derivatives keep trading in an extended session, fully aware of the print.
The design goal is a manipulation-resistant closing price formed by explicit closing interest — the way most developed markets already close (Zerodha’s Z-Connect explainer covers the rulebook well). The side effect is the subject of this post: for thirteen minutes a day the tape you see is frozen, and the number that ends the day can land a long way from it.
Day one: a close above the entire day’s range
Here is what our minute-by-minute prod data recorded on day one:
| Time (IST) | NIFTY spot | NIFTY futures (Aug) |
|---|---|---|
| 15:00–15:14 | 24,560–24,595 | 24,628–24,655 |
| 15:15–15:27 | frozen at 24,573.35 | trading normally |
| ~15:28 | prints 24,774.30 (+200.95, +0.82%) | 24,635 |
| 15:29–15:39 | flat at 24,774.30 | drifts to 24,655 |
The official close — 24,774.30 — was the day’s high, printed above every price that traded in continuous hours. And the derivatives market refused it: futures ended the tail at 24,655, which after subtracting the day’s normal futures premium implied a cash level near 24,595 — roughly 180 points below the official close. The basis, +62 points before the freeze, flipped to a 119-point discount. Options never repriced toward the print either. On a similar basket, the SENSEX auction moved its index by just −38 points the same afternoon.
The next morning settled the argument. NIFTY opened at 24,620.6 — 153.7 points below the official close and within a few points of the futures-implied level. By 09:16 it printed 24,591.95, almost exactly what the derivatives market had said the index was worth. The auction print had fully reverted.
Day two was a weekly expiry — and settlement is the print
Tuesday, 4 August was the NIFTY weekly options expiry, which turned the same mechanics into a settlement event, because final settlement of expiring index options equals the underlying’s official close — which is now the auction print.
The tape froze at 24,463.45. The auction printed 24,614.90, +151.45 above it. Every expiring option settled against that print:
| Strike | Looked like (frozen tape 24,463) | Settled at (print 24,614.90) |
|---|---|---|
| 24500 PE | in the money by ~37 pts | worthless |
| 24550 PE | in the money by ~87 pts | worthless |
| 24600 PE | in the money by ~137 pts | worthless |
| 24500 CE | out of the money | ₹114.90 |
| 24550 CE | out of the money | ₹64.90 |
| 24600 CE | out of the money | ₹14.90 |
A trader watching a frozen screen at 15:20 saw three puts comfortably in the money. All three expired worthless. The calls on the same strikes did the opposite. Nothing on a normal app showed this happening — the index was frozen the whole time.
One more thing our Closing Auction Session tracker caught, and it is the most useful fact in this post: the expiring options saw the print coming. Between 15:23 and 15:27 — with the index still frozen — the 24600 straddle collapsed from 114.5 to 68.75. Expiring options obey put-call parity against the settlement price (C − P = S − K at expiry), so their prices are a live estimate of where the auction will settle, minutes before the feed reprints. On day two, the parity estimate computed after the print matched the actual settlement within 21 paise. The auction is dark, but the expiring chain leaks it.
Update, after the 4 August close: day two was not just a NIFTY story. BSE runs its closing auction session too — both exchanges launched on 3 August — and on day two every index we track printed above its futures-implied level: NIFTY +151.45 (157.7 points above futures-implied cash), BANKNIFTY +414.45, FINNIFTY +183.00, SENSEX +104.39 (115.7 above), BANKEX +150.88 (132.2 above), MIDCPNIFTY +59.05. Six indices, two exchanges, one direction. And SENSEX weekly options settle against BSE’s auction print the same way, so Thursday expiries get the same settlement treatment.
What this means for your numbers
The frozen tape is not the close. From 15:15, the index you see is a placeholder. If you hold expiring options, the number that decides your P&L is the auction print — and it can land three strikes away from the tape, as it just did.
Gap, pivot and percent-change calculations inherit the distortion. Every formula anchored to the official close is now anchored to the auction print. On 4 August the market opened showing roughly −0.9% against the previous close, while the move against the continuous market was about −0.1%. That “gap down” never existed for anyone who traded it. Pivots, CPR and daily-change screeners built on official closes carry the same bias on every divergence day.
The derivatives market issues a verdict every afternoon. Futures minus the pre-freeze basis gives a futures-implied cash level — where the traded market says the index should be. Both closing auction session prints so far landed far above that level, and both were faded: futures refused them into 15:40, GIFT NIFTY tracked the futures overnight, and day one’s print reverted fully at the next open. Two sessions is a pattern worth measuring, not a proven edge — which is exactly why the measurement matters.
How we track it
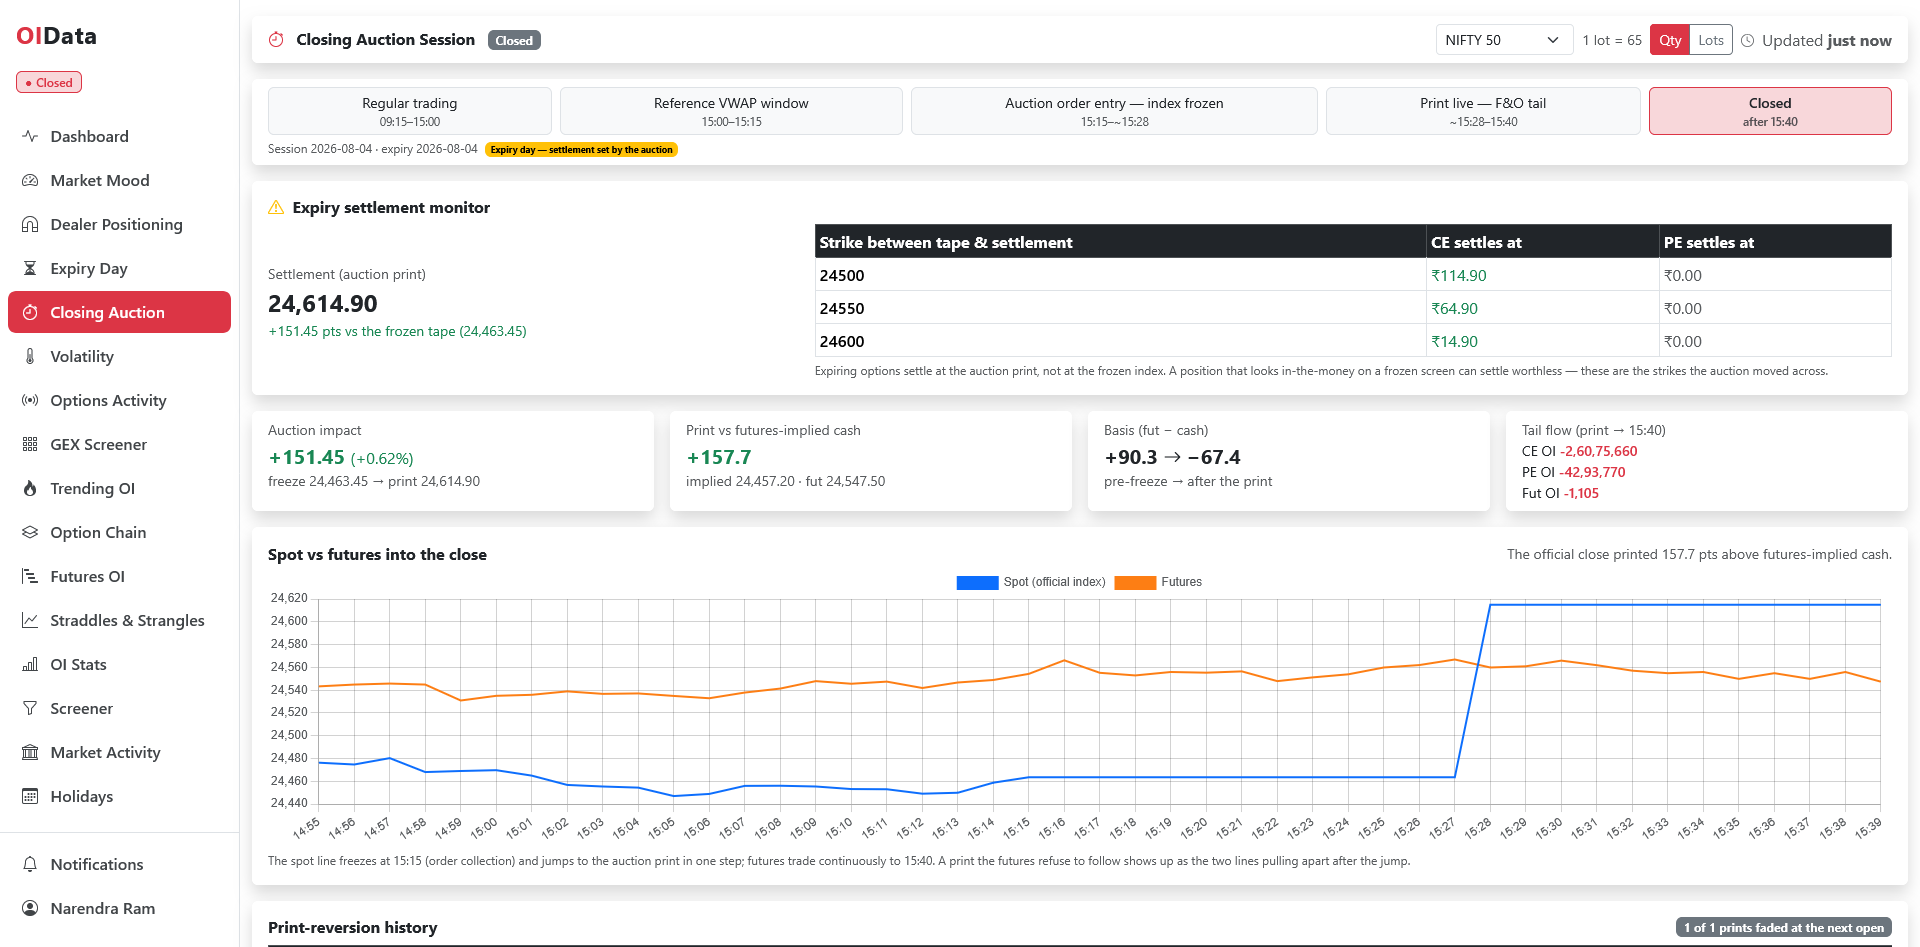
The Closing Auction tracker on OIData watches every session live: the phase strip through the freeze, the auction impact when the print lands, the print measured against futures-implied cash, and the open-interest flow in the 15:30–15:40 tail. On expiry Tuesdays it runs a settlement monitor that shows the options-implied settlement estimate — the parity leak above — while the tape is still frozen, plus the strikes sitting between the tape and the estimate. And every session adds a row to the reversion history: did the next open land nearer the print, or nearer what futures implied? That table starts on day one of the CAS era, so the “is the print information or noise?” question gets answered in public, one session at a time.
The close used to be a summary of trades. Now it is the output of an auction most feeds cannot see into. Treat it accordingly: check what the derivatives market thought before you trust tomorrow’s gap, and if you carry options into expiry afternoons, know that the last thirteen minutes are decided somewhere your chart is not looking.