Once you understand open interest, the next step is mastering the most useful patterns in F&O analysis: the four OI buildup signals. The bullish one is long buildup — fresh buyers committing money to the move. These signals come from a single, powerful idea—combine which way the underlying price moved with which way the open interest shifted. By doing this, you get a surprisingly clear, real-time picture of what kind of smart money is driving the market, whether they are building fresh bullish positions or aggressively shorting. Let’s break down how to read all four signals to level up your trading.
The two numbers behind every OI buildup signal
You only need two inputs over a chosen period (a day, an hour, a 15-minute bar):
- Did price go up or down?
- Did open interest rise or fall? (Rising OI = new positions being created. Falling OI = positions being closed. If that’s fuzzy, see What Is Open Interest?.)
Two questions, two answers each → four combinations.
The four OI buildup scenarios
| Price | Open Interest | Signal | What it means | Bias |
|---|---|---|---|---|
| Up | Up | Long buildup | Fresh longs entering; new money backing the rise | Bullish |
| Down | Up | Short buildup | Fresh shorts entering; new money backing the fall | Bearish |
| Up | Down | Short covering | Shorts buying back to exit; price rises as they cover | Bullish (often temporary) |
| Down | Down | Long unwinding | Longs selling to exit; price falls as they leave | Bearish (often weakening) |
Long buildup (price ↑, OI ↑)
New buyers are opening fresh long positions and price is rising to accommodate them. Because the move is powered by new money rather than old positions closing, a long buildup is generally the most durable bullish signal. The trend has fuel behind it.
When you spot a consistent long buildup over several trading sessions, it often indicates institutional accumulation. F&O traders watch the Nifty and Bank Nifty futures closely for this pattern. According to guidelines and market reports on NSE India, tracking open interest alongside daily price movements helps market participants understand systemic risk and market depth. A sustained long buildup suggests that big players are willing to carry their positions overnight, showing strong conviction in the bullish trend.
Short buildup (price ↓, OI ↑)
The mirror image: new sellers are opening fresh shorts and price is falling. New money is betting on more downside, so a short buildup is the most durable bearish signal.
Short covering (price ↑, OI ↓)
Price is rising, but open interest is falling — so this isn’t new buyers, it’s existing shorts buying back to close. That buying pushes price up, but the fuel is finite: once the shorts have covered, the bid can vanish. Short-covering rallies can be sharp but are often less durable than a long buildup. Treat a rally on falling OI with more caution than one on rising OI.
Long unwinding (price ↓, OI ↓)
Price is falling while open interest falls too — existing longs selling out. It’s bearish in tone, but like short covering it can be self-limiting: once the weak longs are gone, the selling pressure eases. A decline on falling OI is “longs giving up” rather than “fresh shorts attacking.”
Telling a real long buildup from noise
Not every green day with rising open interest is a high-conviction long buildup. To filter out intraday noise and find reliable setups, successful derivative traders look for specific confirmation metrics:
- The Volume Spark: A true long buildup is backed by rising volume. If open interest goes up by 5% but trading volume is dry, the move lacks institutional participation. Always verify that trading volumes are matching the OI momentum. Learn more about this crucial dynamic in our guide on Open Interest vs Volume — What’s the Difference (and Why It Matters).
- Delivery Percentage (for Stock Futures): For individual stock futures, check the delivery percentage in the cash segment. If a stock shows a long buildup in futures and high delivery buying in cash, it is a double-confirmation that long-term investors are acquiring the stock.
- Sustainability over Multiple Sessions: A single 15-minute candle showing a long buildup is just noise. Look for a persistent increase in cumulative open interest across consecutive days. A multi-day buildup is where major trend reversals or breakout continuations are born.
Using OI buildup signals in a strategy
Once you can comfortably identify these four scenarios, you can begin integrating them into actionable trading systems. Here are two professional-grade strategies used by Indian F&O traders:
1. The Breakout Confirmation Strategy
When a stock is consolidating near a major resistance level, watch the futures OI closely. * The Setup: The price approaches the resistance line. * The Signal: As the price breaks above resistance, both price and open interest spike upward. * The trade: a classic long-buildup breakout. It tells you that new buyers are actively funding the breakout, rather than the move being a temporary stop-hunting spike. Enter long with a stop-loss just below the broken resistance level.
2. The Short-Squeeze/Short-Covering Play
Short-covering rallies can be incredibly violent, offering quick profits for options buyers. * The Setup: A heavily shorted stock (indicated by a prior massive short buildup) begins to stabilize at a key support zone. * The Signal: Price starts rising, but open interest begins to plummet sharply. This indicates that trapped short-sellers are scrambling to buy back their contracts to limit losses. * The Trade: Ride the momentum by buying near-the-money Call options. However, because short covering is temporary, keep tight profit targets. Once the open interest stabilizes or starts rising on falling prices, exit immediately.
Worked OI buildup examples
- NIFTY futures up 0.8%, OI up 4% → long buildup. New longs are backing the rally; the up-move has conviction.
- A stock down 3%, OI up 12% → short buildup. Traders are piling into fresh shorts; expect continued pressure unless price reclaims a level.
- BANK NIFTY up 1.2%, OI down 6% → short covering. The bounce is shorts running for the exit; don’t assume it’s the start of a new uptrend without further confirmation.
- A stock down 1%, OI down 5% → long unwinding. Holders are trimming; the selling may be running out of sellers.
The options nuance (read this before applying it to the chain)
The four-quadrant model is cleanest on futures and on the underlying index, where “long” and “short” are unambiguous. Options add a wrinkle, because rising OI at a strike could be buying or writing:
- Rising call OI with a rising call premium → call buying (bullish lean).
- Rising call OI with a falling call premium → call writing (bearish lean — resistance forming).
- Rising put OI with a rising put premium → put buying (bearish lean).
- Rising put OI with a falling put premium → put writing (bullish lean — support forming).
So on the How to Read the NIFTY & BANK NIFTY Option Chain, pair change-in-OI with the option’s own price to tell buying from writing. For a clean directional buildup read, use the futures.
How to use OI buildup in practice
- Confirm trends. A breakout with a long (or short) buildup has new money behind it — higher quality than one on covering/unwinding.
- Fade exhaustion carefully. Rallies on short covering and declines on long unwinding can stall once the closing flow is done. Don’t chase them blindly.
- Combine with volume. Buildup + a volume spike is stronger confirmation than buildup alone — see Open Interest vs Volume.
Caveats
- OI is end-of-day authoritative. Intraday change-in-OI is a live hint; the EOD figure is the clean record.
- Expiry distorts everything. Near expiry, OI falls across the board as contracts settle and roll — don’t mistake routine expiry unwinding for a directional signal.
- One signal isn’t a trade. Buildup describes what’s happening, not what to do. Use it with levels, price action and risk management.
Regulatory Limits and Market-Wide Position Limits (MWPL)
In the Indian context, the Securities and Exchange Board of India (SEBI) monitors speculation carefully. When the combined open interest of all active derivative contracts for a stock crosses 95% of the Market-Wide Position Limit (MWPL), the stock enters the F&O Ban period. During this ban, traders can only close existing positions; opening fresh positions is prohibited. If you spot a massive long buildup or short buildup pushing a stock close to its MWPL, be extremely cautious. Once it enters the ban list, liquidity dries up, and the momentum can reverse abruptly as traders are forced to unwind.
On OIData
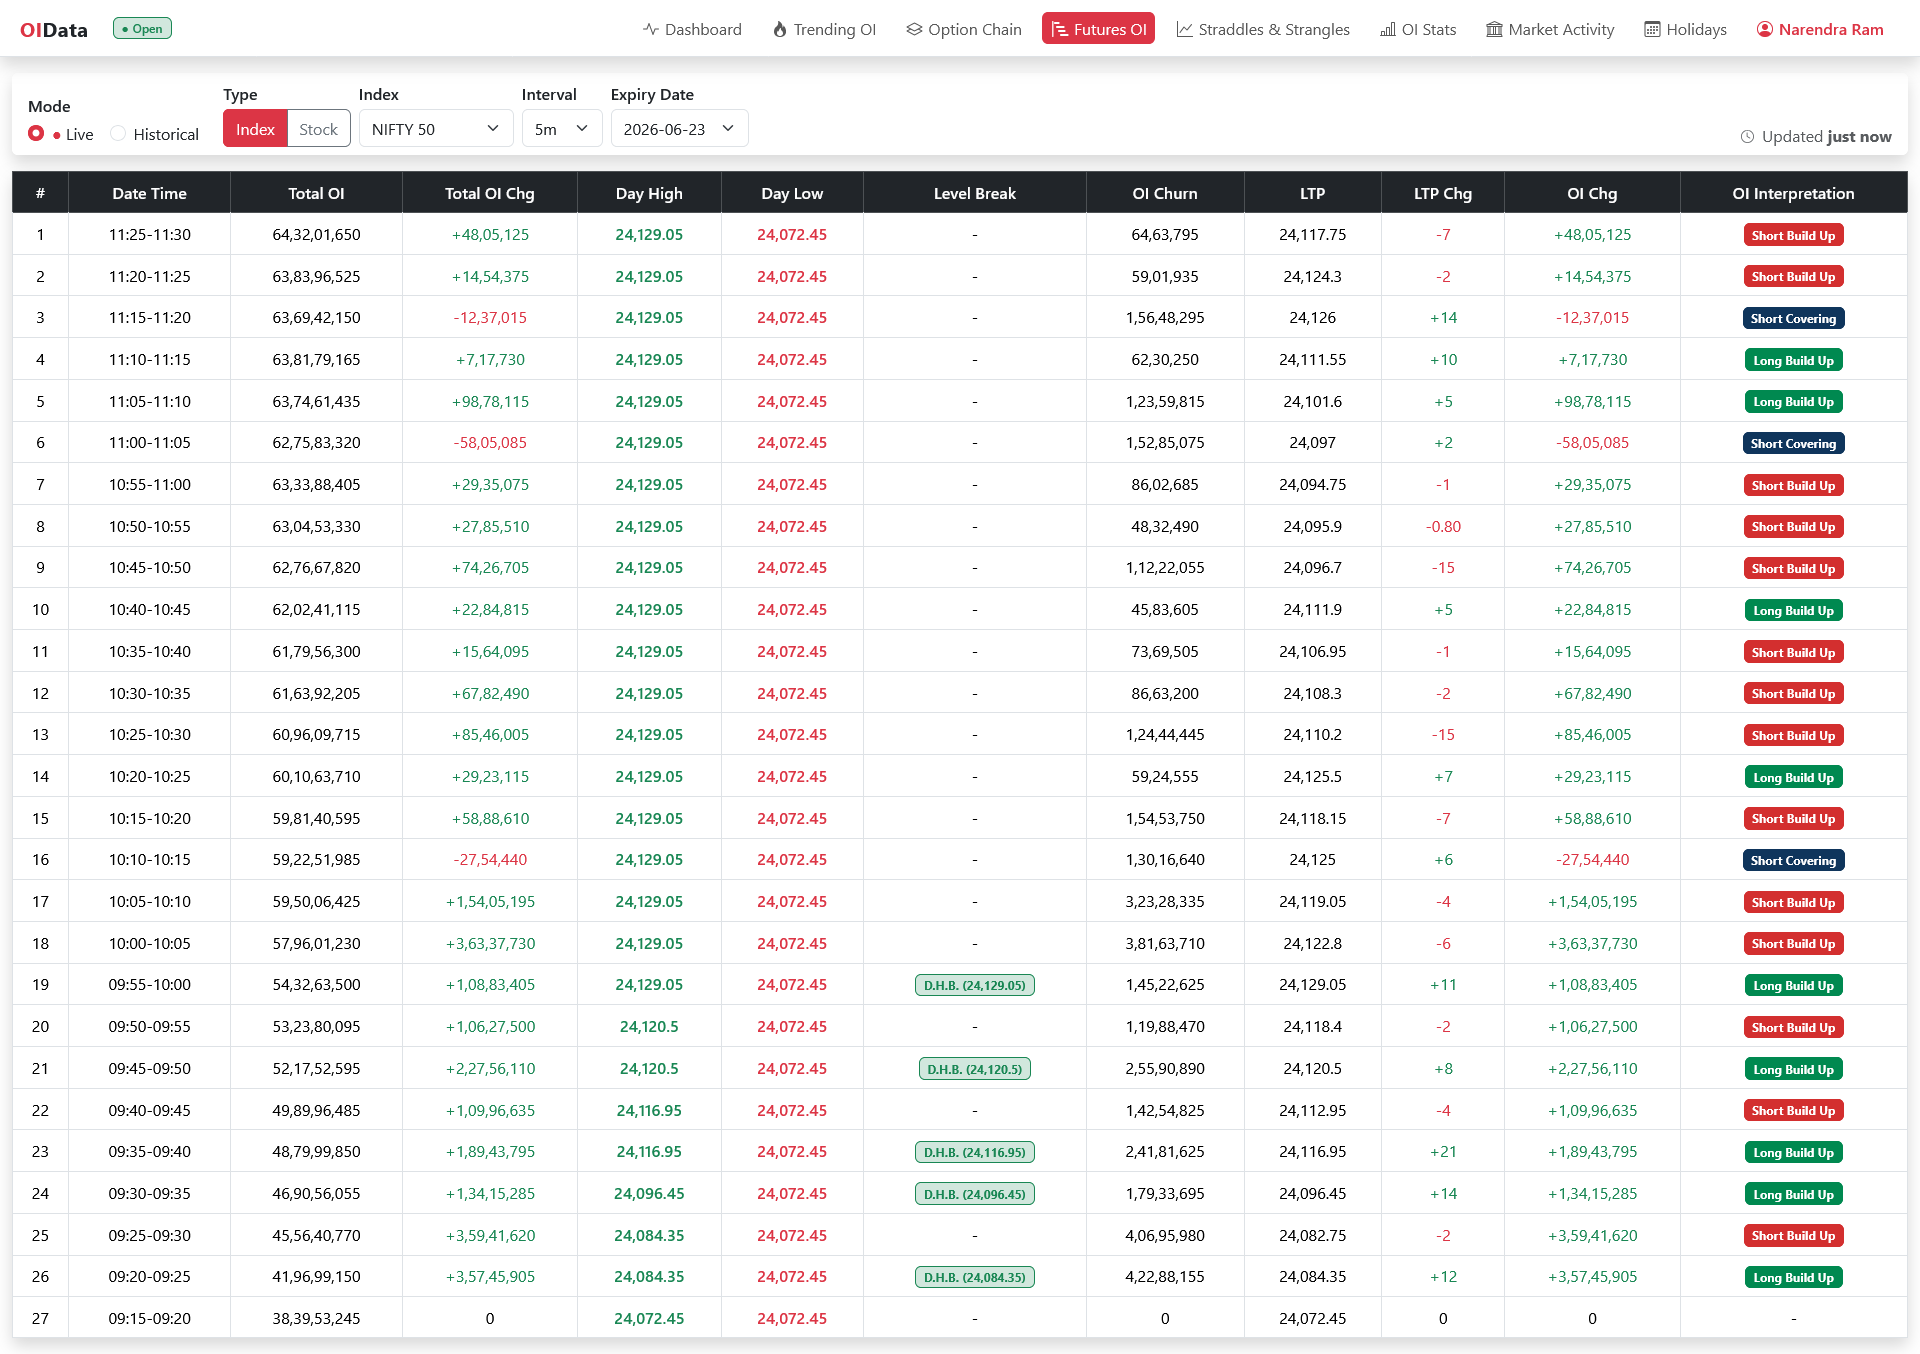
- Futures OI is where the four signals read most cleanly.
- Trending OI surfaces the strongest buildups and unwinds across instruments so you can spot them quickly.
- The Dashboard rolls these reads into a single daily view.
Related reading
To rank the whole F&O universe by these four OI buildup states at once instead of checking one symbol at a time, see screening stocks for long and short buildup, which applies the same OI buildup logic to every F&O name.
Takeaways
- Combine price direction with OI direction to get four signals:
- ↑price ↑OI = long buildup (durable bullish)
- ↓price ↑OI = short buildup (durable bearish)
- ↑price ↓OI = short covering (bullish, often temporary)
- ↓price ↓OI = long unwinding (bearish, often weakening)
- Moves on rising OI carry new money and tend to last; moves on falling OI are positions closing and can fade.
- Use futures for clean directional reads; on options, pair OI change with the option’s price to tell buying from writing.