There is a level on the NIFTY chart that no chart draws. On one side of it, moves get absorbed; on the other, the same moves get amplified. That level is the gamma flip — the index price at which net gamma exposure crosses zero — and knowing where it sits tells you which of two very different markets you are trading today.
It is not support or resistance in the usual sense. Price does not bounce off the gamma flip. Price changes character when it crosses.
What the gamma flip level is
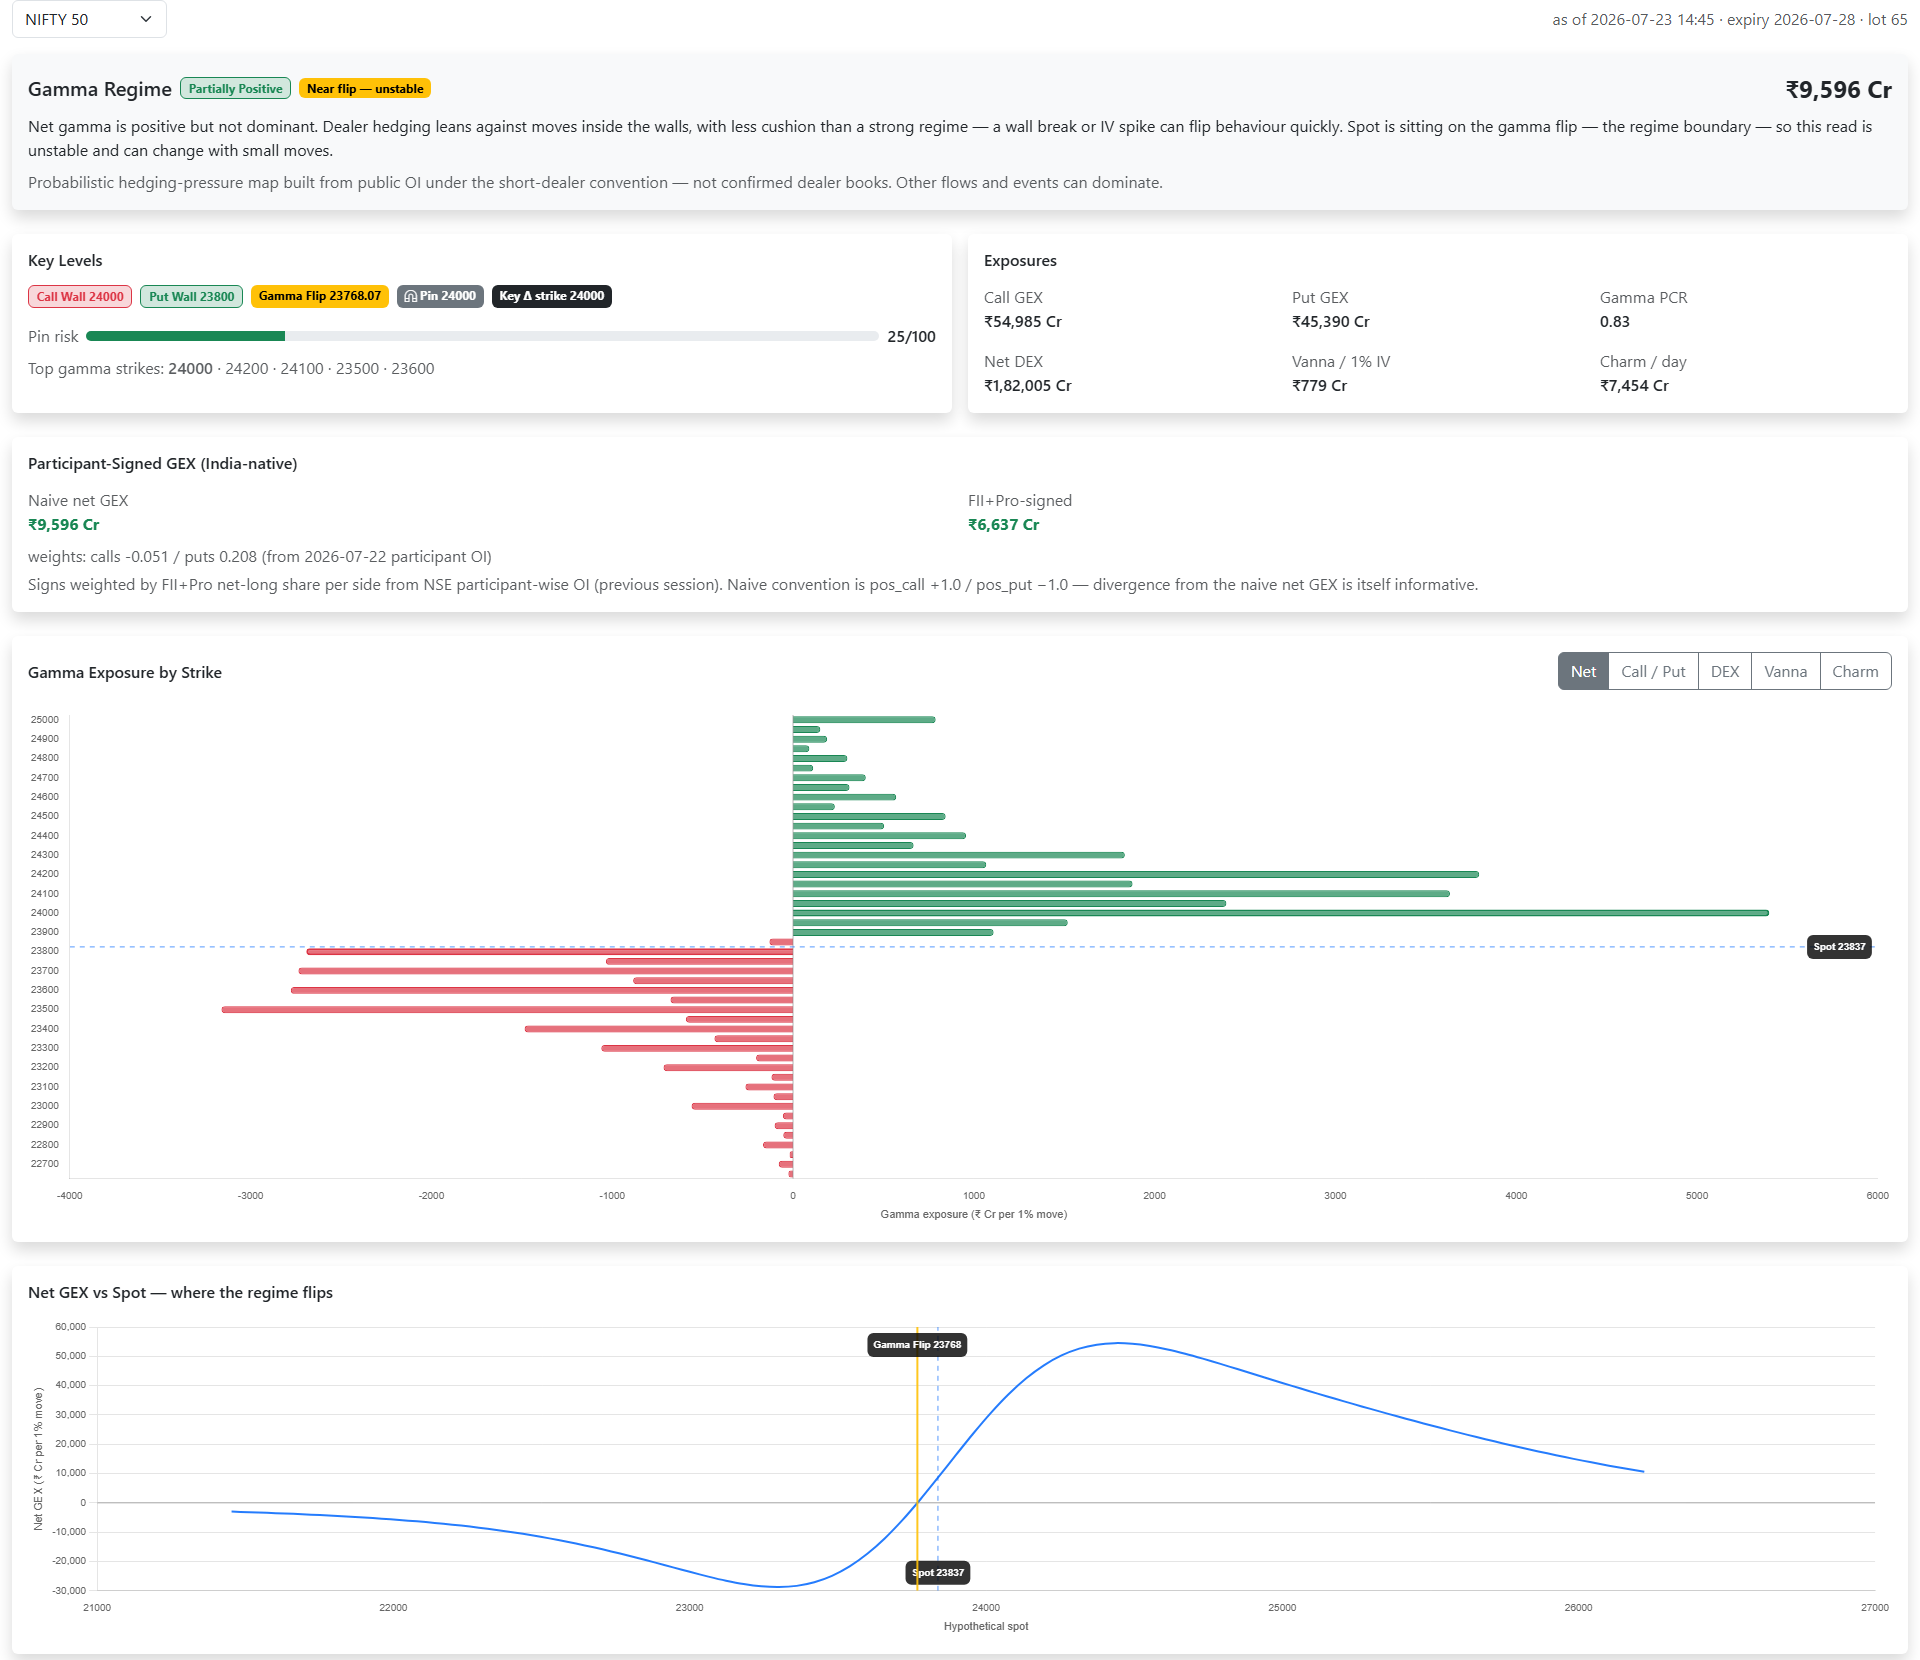
Net gamma exposure is not a single fixed number. It is a function of spot. Move the index and every option’s moneyness changes, which changes every option’s gamma, which changes the total.
So to find the flip you re-price the whole chain at a grid of hypothetical spot levels. OIData sweeps ±10% around spot in 0.25% steps, recomputing each strike’s gamma with Black-Scholes at every step while holding that strike’s implied volatility and the time to expiry fixed. The result is a curve: net gamma exposure plotted against spot. The gamma flip is where that curve crosses zero, taking the crossing nearest current spot.
The re-pricing is not optional. The gammas the exchange publishes are only valid at the spot they were computed at, so carrying them unchanged across the grid would produce a meaningless curve.
Why crossing it changes the tape
On the positive-gamma side, hedging flows lean against price. Dips get bought and rallies sold, not out of any view but because staying delta-neutral requires it. Realised volatility comes in under what the options are pricing. Ranges hold, breakouts fail, and premium selling is the easier side of the trade.
On the negative-gamma side, hedging flows chase price. A move up forces hedge buying, which extends the move, which forces more buying. Trends persist, stops get run, gaps stay open, and buying premium finally pays.
Same index, same chain, two completely different games — separated by the gamma flip.
Reading which side you are on — don’t assume
Most write-ups tell you positive gamma sits above the flip and negative below it. That is the common configuration, not a law, and it is worth checking rather than assuming.
The screenshot is a clean counter-example. Spot is 23788 and the gamma flip is 23806.20, so spot sits eighteen points below the flip — yet net gamma exposure is positive at ₹1,880 Cr. The curve simply was not shaped the textbook way that afternoon, with three days to expiry and a heavy call wall overhead.
That is exactly why OIData plots the full Net GEX vs Spot sweep instead of only printing a level. Read the curve, locate yourself on it, and you never have to guess which regime you are in.
The “near flip” warning
When spot comes within 0.3% of the flip, OIData tags the regime Near flip — unstable and appends a line to the read: “Spot is sitting on the gamma flip — the regime boundary — so this read is unstable and can change with small moves.”
In the screenshot those eighteen points are 0.08% — well inside the band. And there is a second, independent reason to distrust the regime that afternoon: net GEX of ₹1,880 Cr against roughly ₹108,000 Cr of gross gamma is a net ratio near 0.02. Positive, but nowhere near the 0.35 that would earn a “strongly” label.
Two warnings pointing the same way. Near the flip, and with a net that thin, any strategy whose edge depends on the regime has essentially no edge at all. That is a fine reason to size down or stand aside — and a bad time to conclude “positive gamma, so sell premium”.
Pin risk and the gamma flip into expiry
Pin risk — 34 out of 100 in the screenshot — scores how strongly spot is likely to be held near a particular strike as expiry approaches.
The mechanism is time, not magic. As days to expiry fall, gamma concentrates violently into the at-the-money strikes: the wings go inert while the ATM strike’s delta becomes hair-trigger. Hedging flow therefore piles into a narrower and narrower band of prices, and if that band is one heavily-written strike, price gets held there. It is the same dynamic behind max pain, read through gamma rather than through payouts.
Charm is the other half of the expiry story. At ₹10,048 Cr per day in the screenshot, charm measures the hedge that unwinds purely because time passed — no price movement required. It is why expiry-week afternoons so often drift quietly in one direction: the flows are running off a clock. The mechanics of that session are covered in expiry day trading using open interest.
Trading around the gamma flip
- It is a regime, not an entry. The gamma flip tells you which playbook applies. It does not tell you what to buy.
- Let it pick the strategy. Comfortably positive: range tactics and premium selling. Comfortably negative: momentum, wider stops, and long premium. Near the flip: neither.
- Treat the cross as an event. Spot crossing the flip, or aggregate net gamma changing sign, are the moments the character of the tape changes. Both are available as alerts so you are not watching for them manually.
- Read it with the walls. The flip says how moves behave; the call and put walls say where they are likely to stall. Together they frame the day.
Where the model can be wrong
- It rests on a convention. Net gamma exposure signs call gamma positive and put gamma negative because public OI never reveals who is long. The participant-signed cross-check on the same page exists to test that.
- The sweep holds IV fixed. In reality implied volatility moves when spot moves — that is vanna — so the true curve shifts as the market travels along it. The flip is an estimate, not a fixed coordinate.
- It moves through the session. The flip is recomputed live. A level from the morning can be a hundred points away by the afternoon.
- Events dominate. No hedging model survives a surprise policy decision.
An excellent primer on the underlying greek is Investopedia’s explainer on gamma, which covers the option-level maths this page aggregates.
On OIData
The Dealer Positioning page publishes the gamma flip level as a badge, plots the Net GEX vs Spot sweep the level is derived from, and flags the near-flip condition automatically. On Alerts you can have “Gamma flip crossed” and “Gamma regime flipped” delivered when they happen instead of watching for them.
Takeaways
- The gamma flip is where net gamma exposure crosses zero, found by re-pricing the whole chain across a spot grid.
- One side dampens moves, the other amplifies them — check the curve rather than assuming which is which.
- Within 0.3% of the flip the regime read is unstable, and a thin net ratio makes it thinner still.
- Pin risk and charm explain expiry-week behaviour: gamma concentrates at the money and hedges unwind on the clock.
- Use it to choose a playbook, never as a directional trigger.