Read the market's open interest before you trade
Live OI momentum, dealer positioning (GEX), option chain, futures, straddle/strangle premiums and an AI-grounded daily read — for NIFTY, SENSEX, stock options and futures, in one clean, distraction-free workflow.
AI-powered analytics
Data analytics powered by AI — the day's read in a few plain sentences.
Key market indicators
OI shifts, PCR, sentiment and key support/resistance levels.
Multi-market
Index options, stock options and futures in one place.
Distraction-free
Fast, clean UI built for quick reads — no clutter.
Professional tools, one simple plan
A complete open-interest suite — everything you need for fast, data-driven decisions.
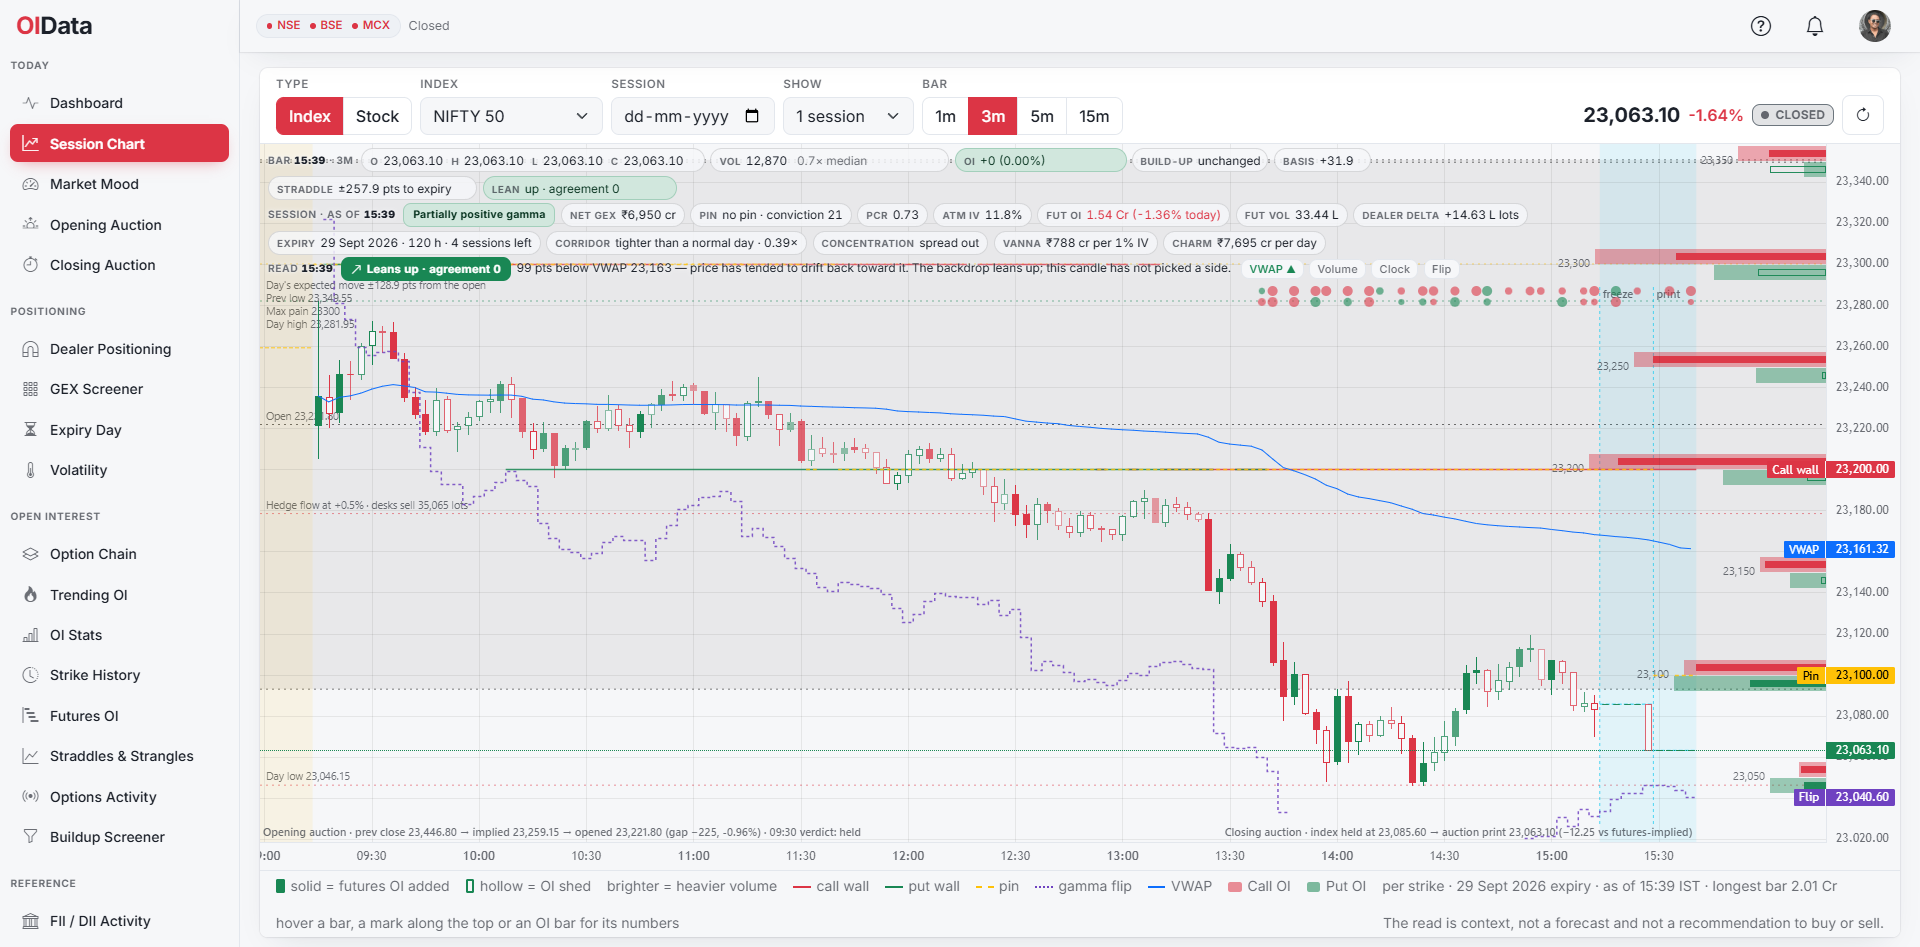
Watch the whole session on one chart
Minute candles for any index or F&O stock with every level the app computes drawn at its price: the call and put walls, the pin, the gamma flip and VWAP. The auctions are shaded, the day's events marked, and per-strike open interest sits beside the price.
- Levels refresh every minute, price every 15 seconds
- Hover any bar for its OI change, build-up, basis and straddle
- Replay any recorded session, minute by minute
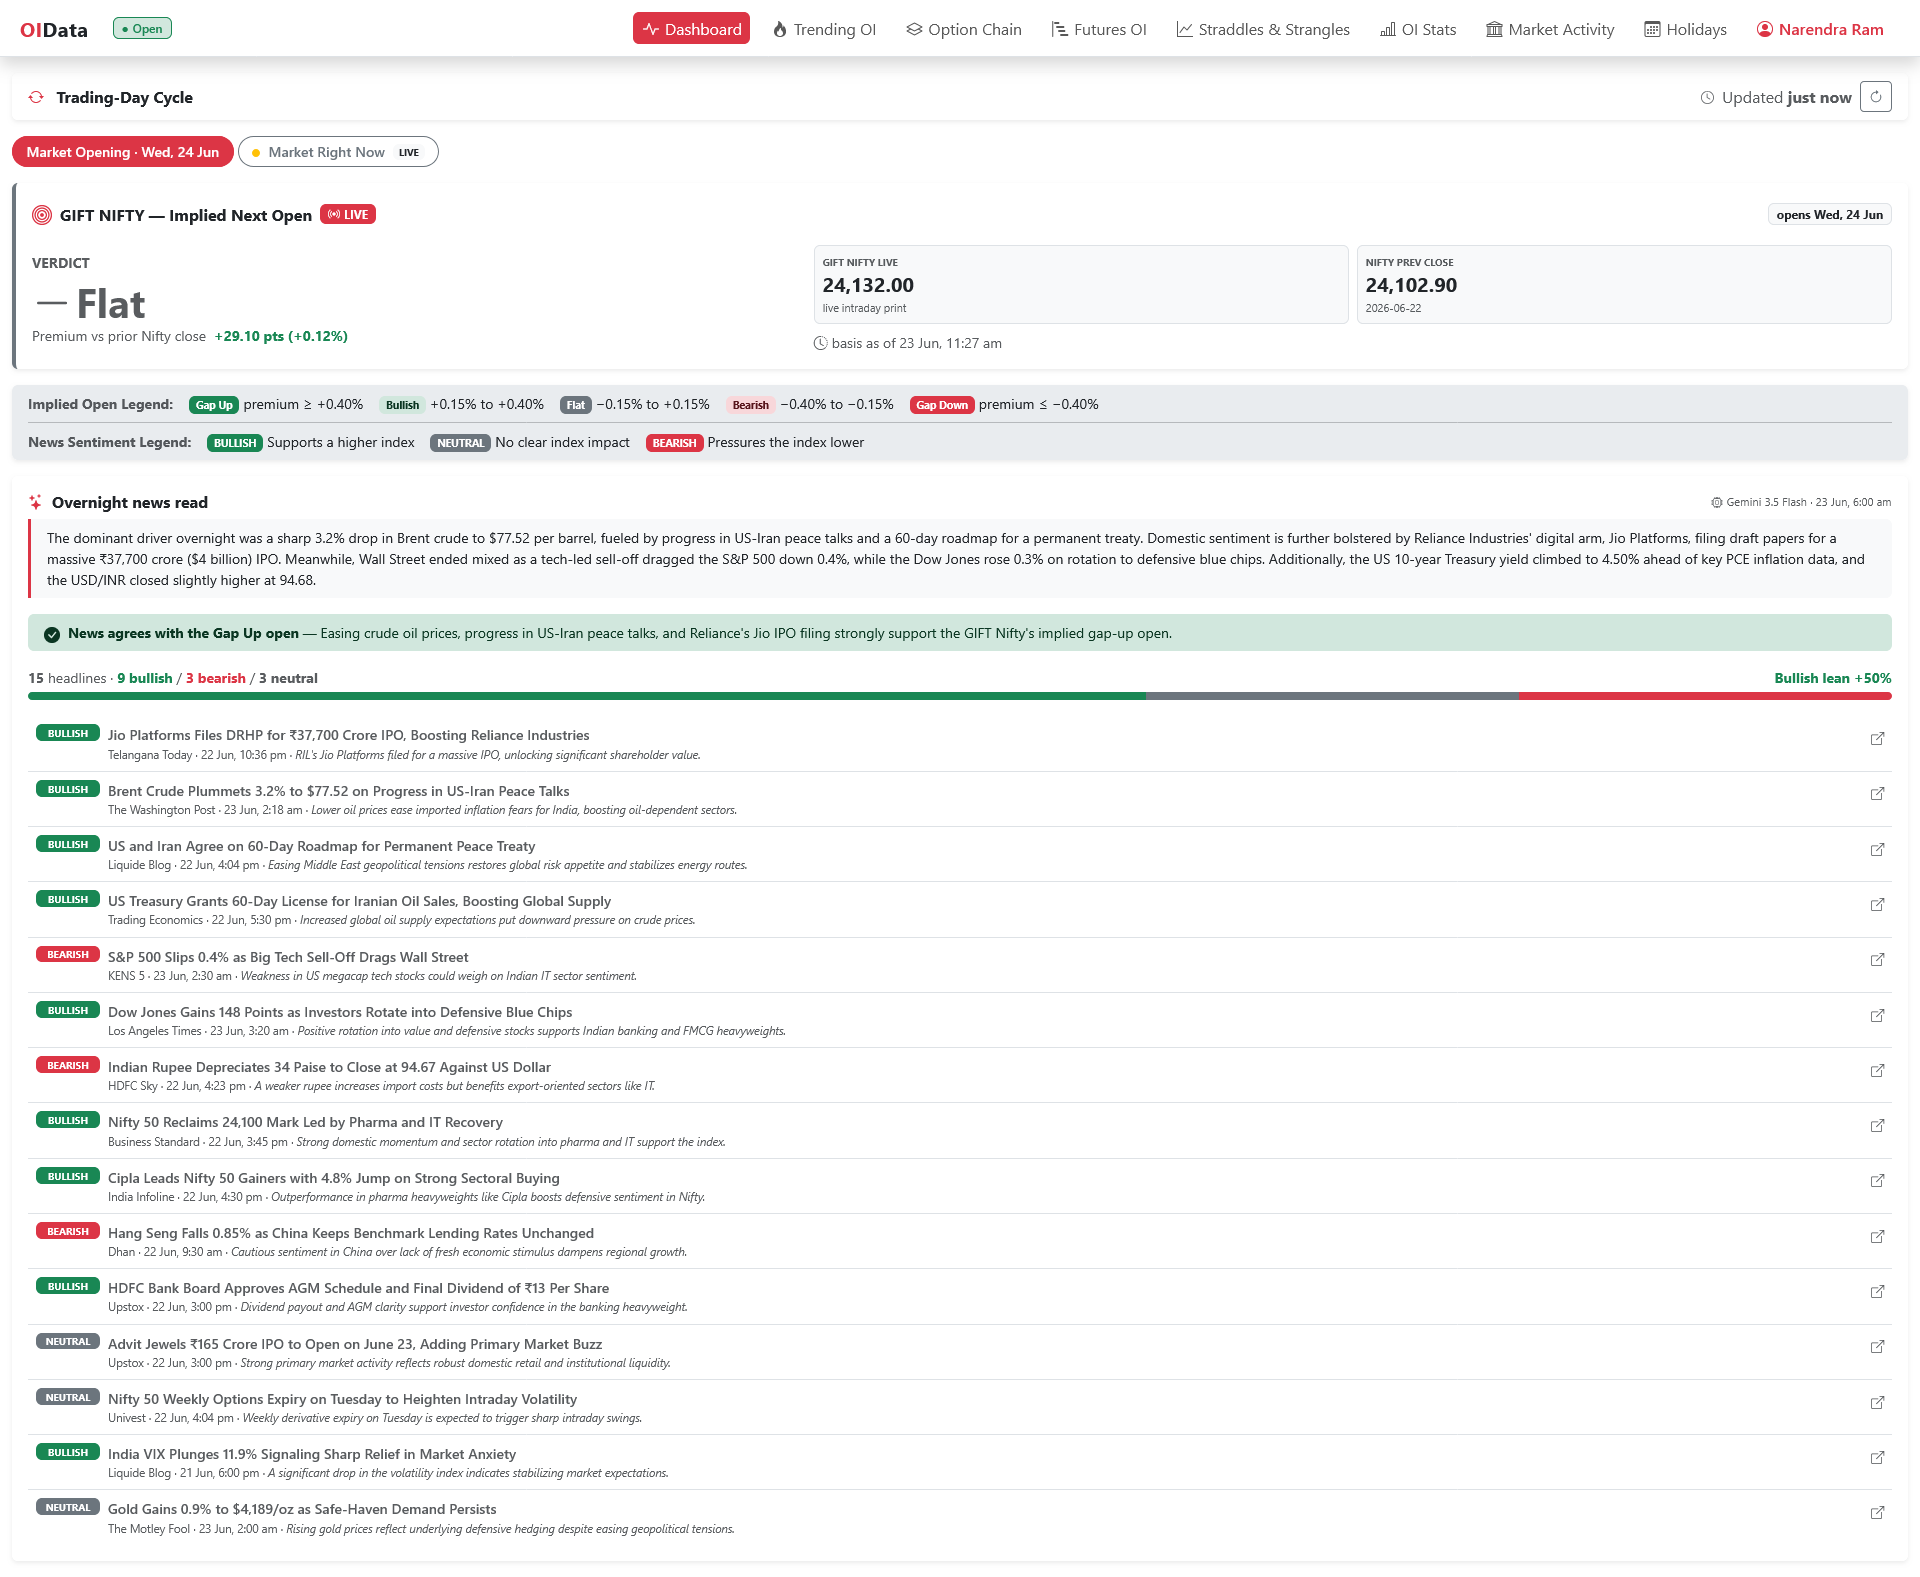
Start your day with an AI-grounded market read
A twice-daily, AI-assisted read of the market — GIFT NIFTY implied open, an overnight news digest and a bullish/bearish headline breakdown so you walk in prepared.
- GIFT NIFTY implied next open with a clear verdict
- Overnight news sentiment, scored and summarised
- Bullish vs bearish headline split at a glance
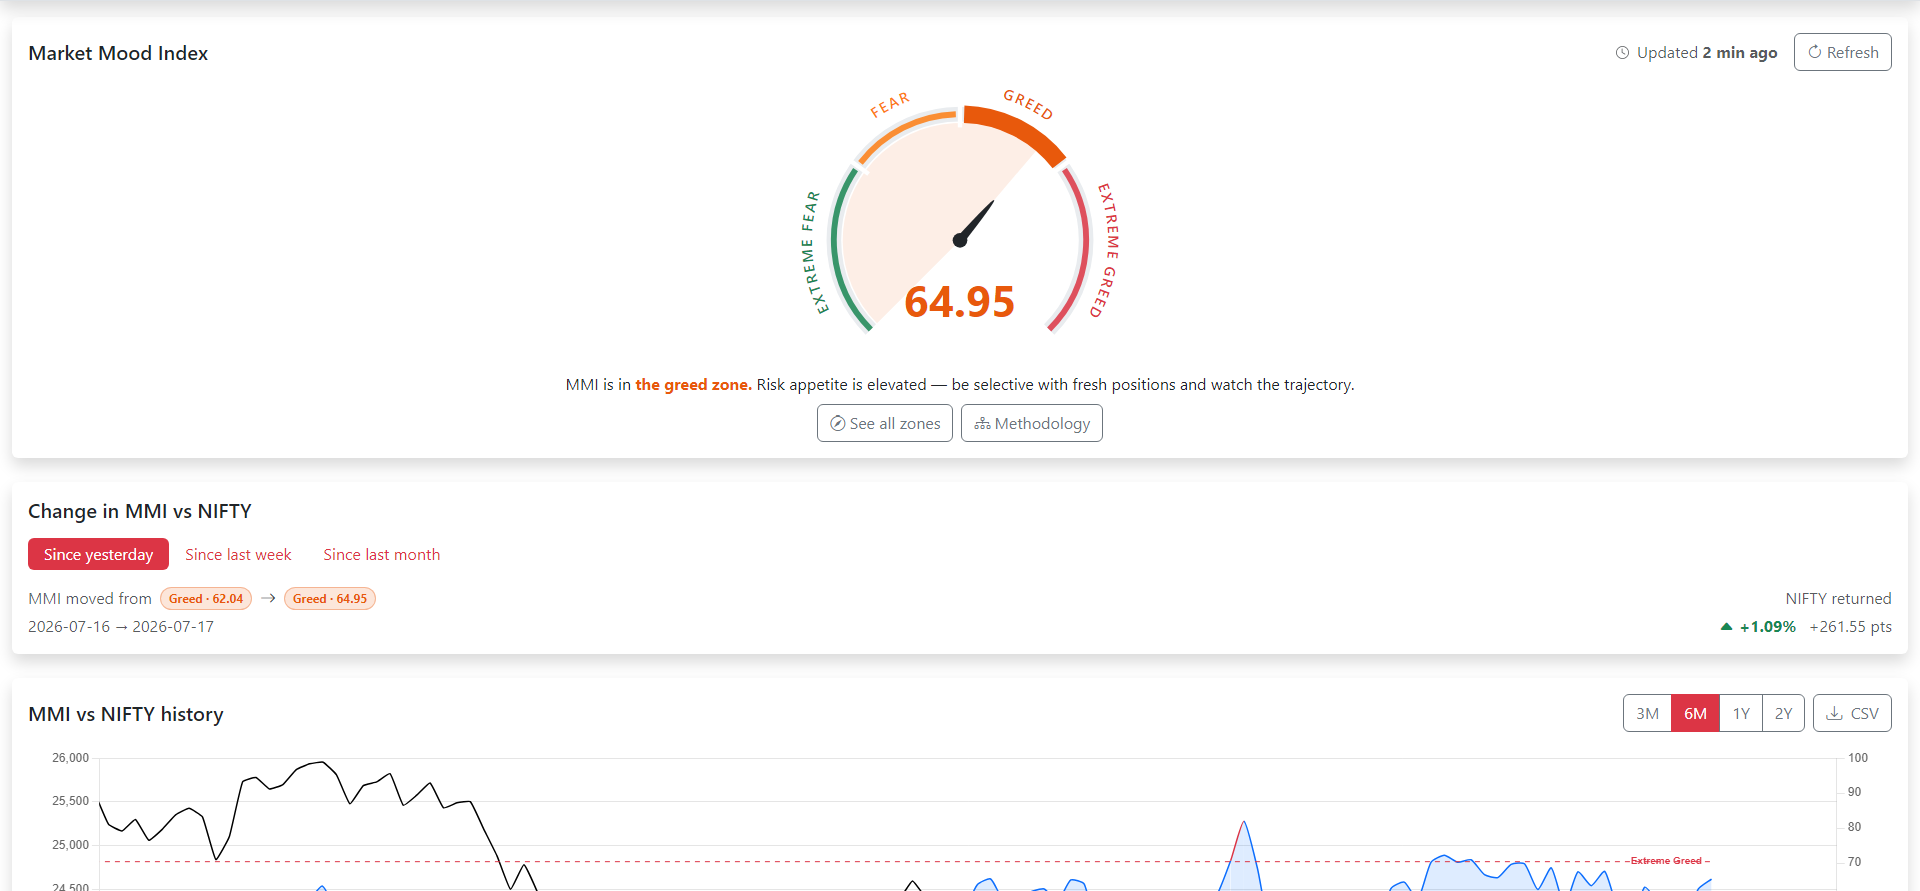
Know the street's fear & greed in one number
A 0–100 Market Mood Index built from seven market internals — FII index-futures positioning, India VIX, option skew, Nifty momentum, market breadth, 52-week strength and gold demand — updated live during the session.
- Four zones with clear contrarian guidance
- Change vs NIFTY since yesterday, last week and last month
- Two years of MMI-vs-NIFTY history with extreme-zone markers
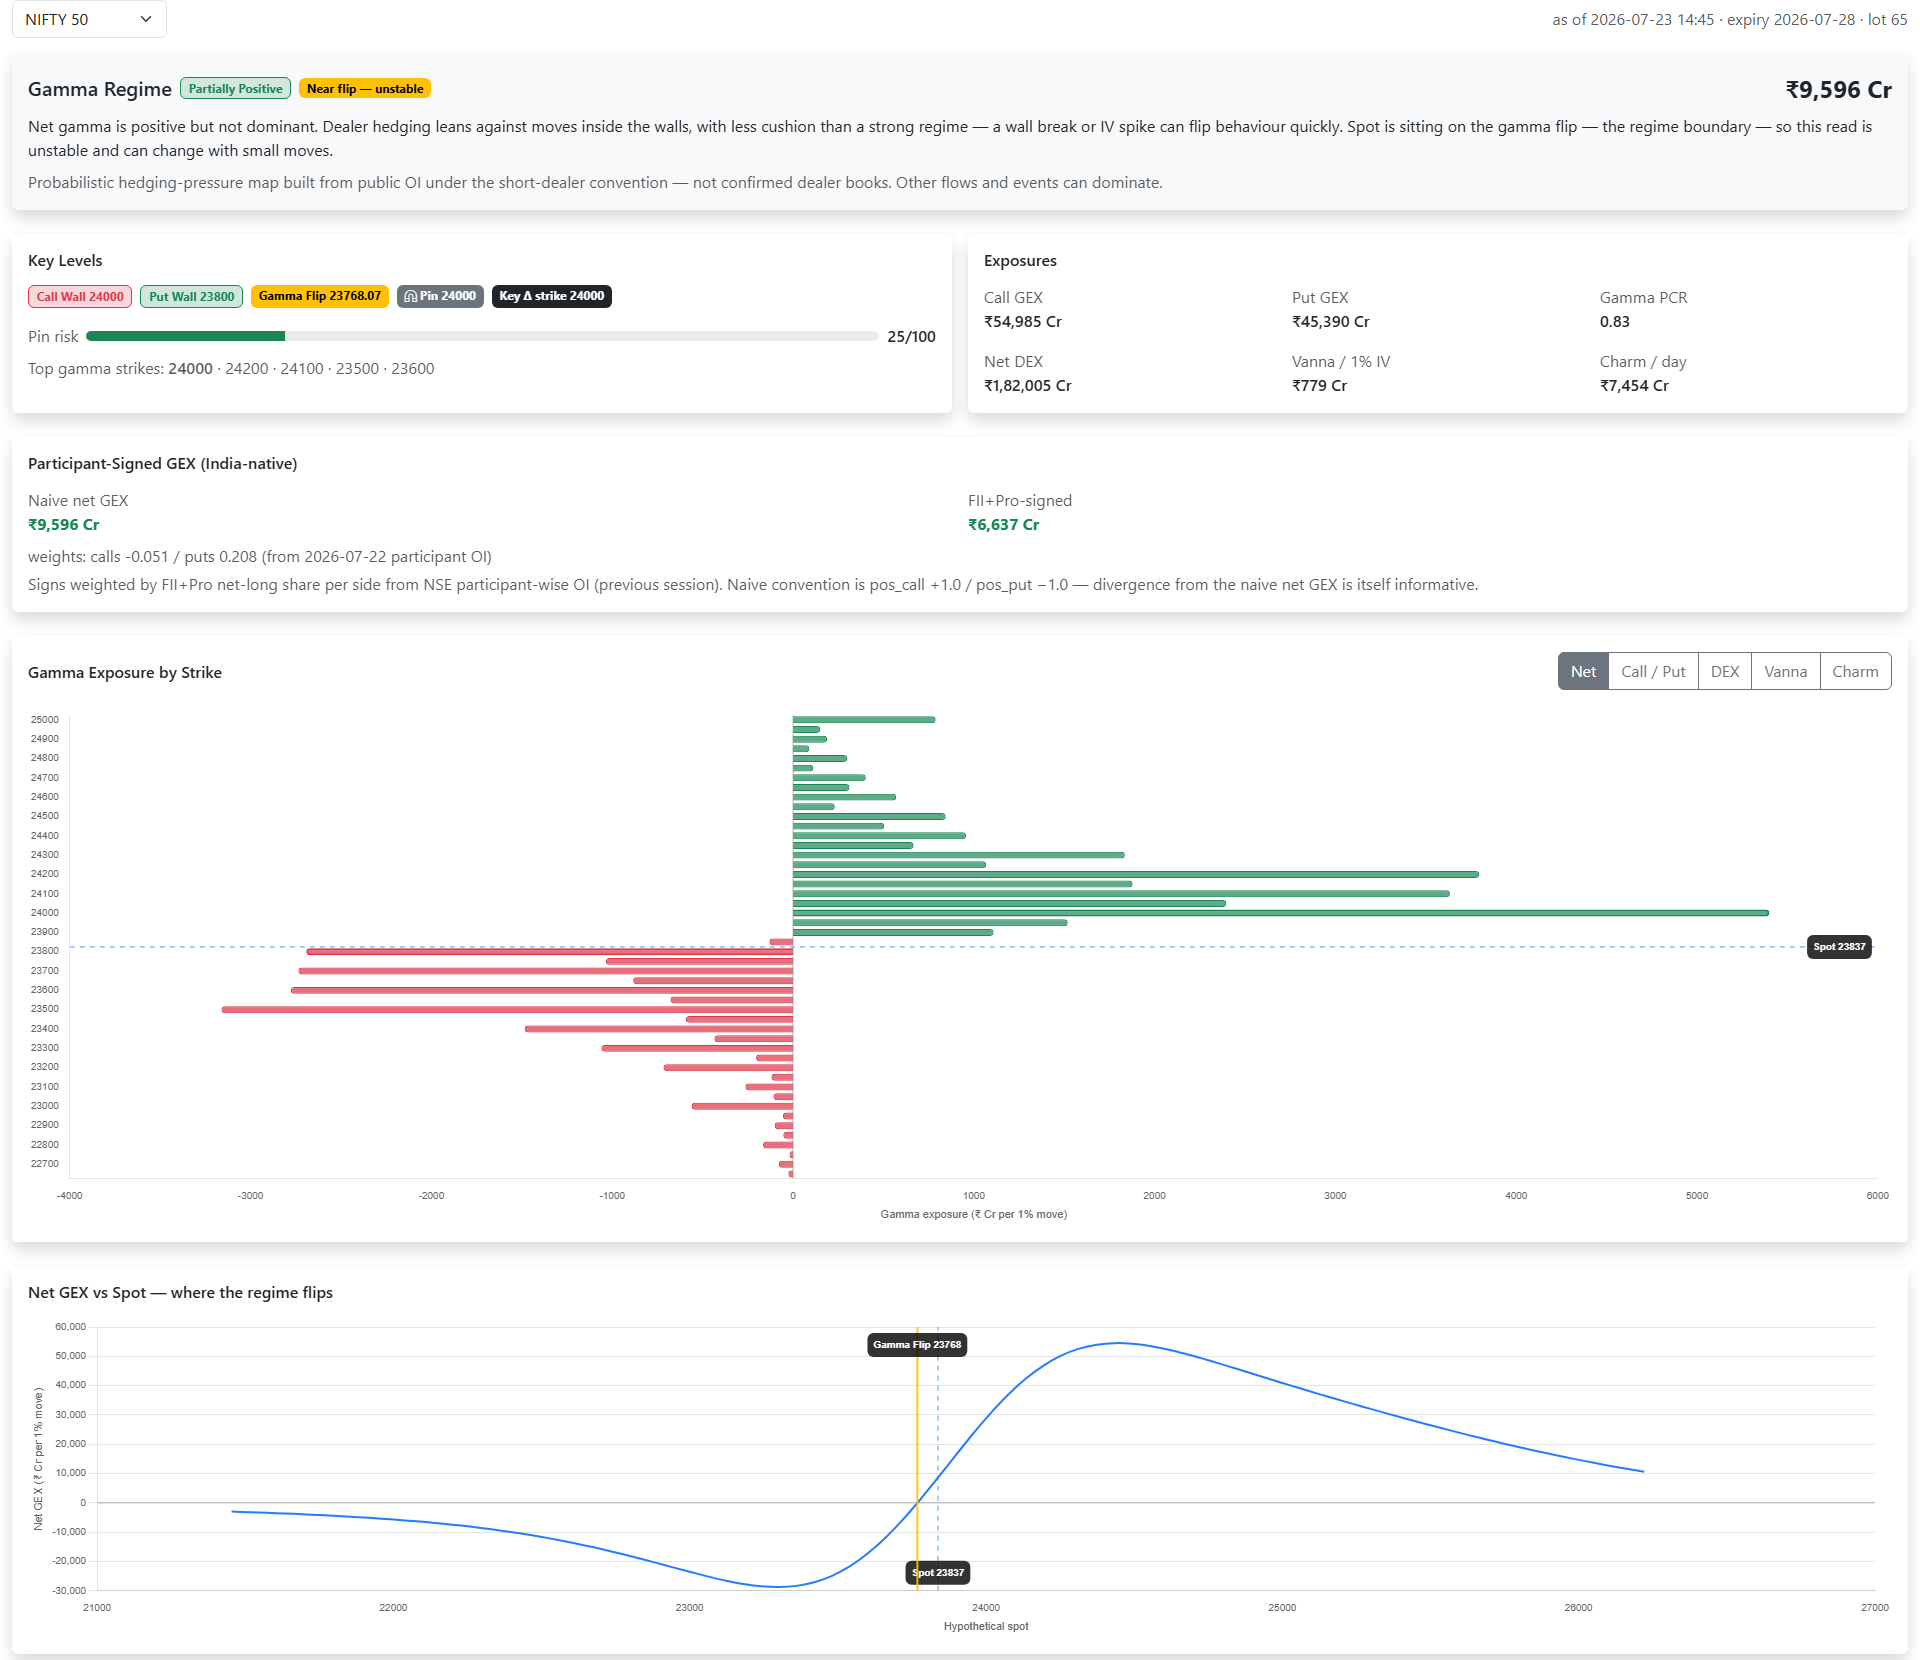
See where hedging pressure sits with the live dealer cockpit
Net GEX by strike with the walls, the corridor between them and the gamma flip — updated every minute through the session, with a timeline you can replay. Pin conviction says which strike is pulling price and how much to trust it; the hedge ladder shows what dealers must trade at each price step.
- Live every minute: walls, flip, pin conviction, gamma concentration
- Hedge ladder, IV-shock and time-to-expiry sliders, 30-session regime river
- Indices and any F&O stock, with DEX, Vanna and Charm views
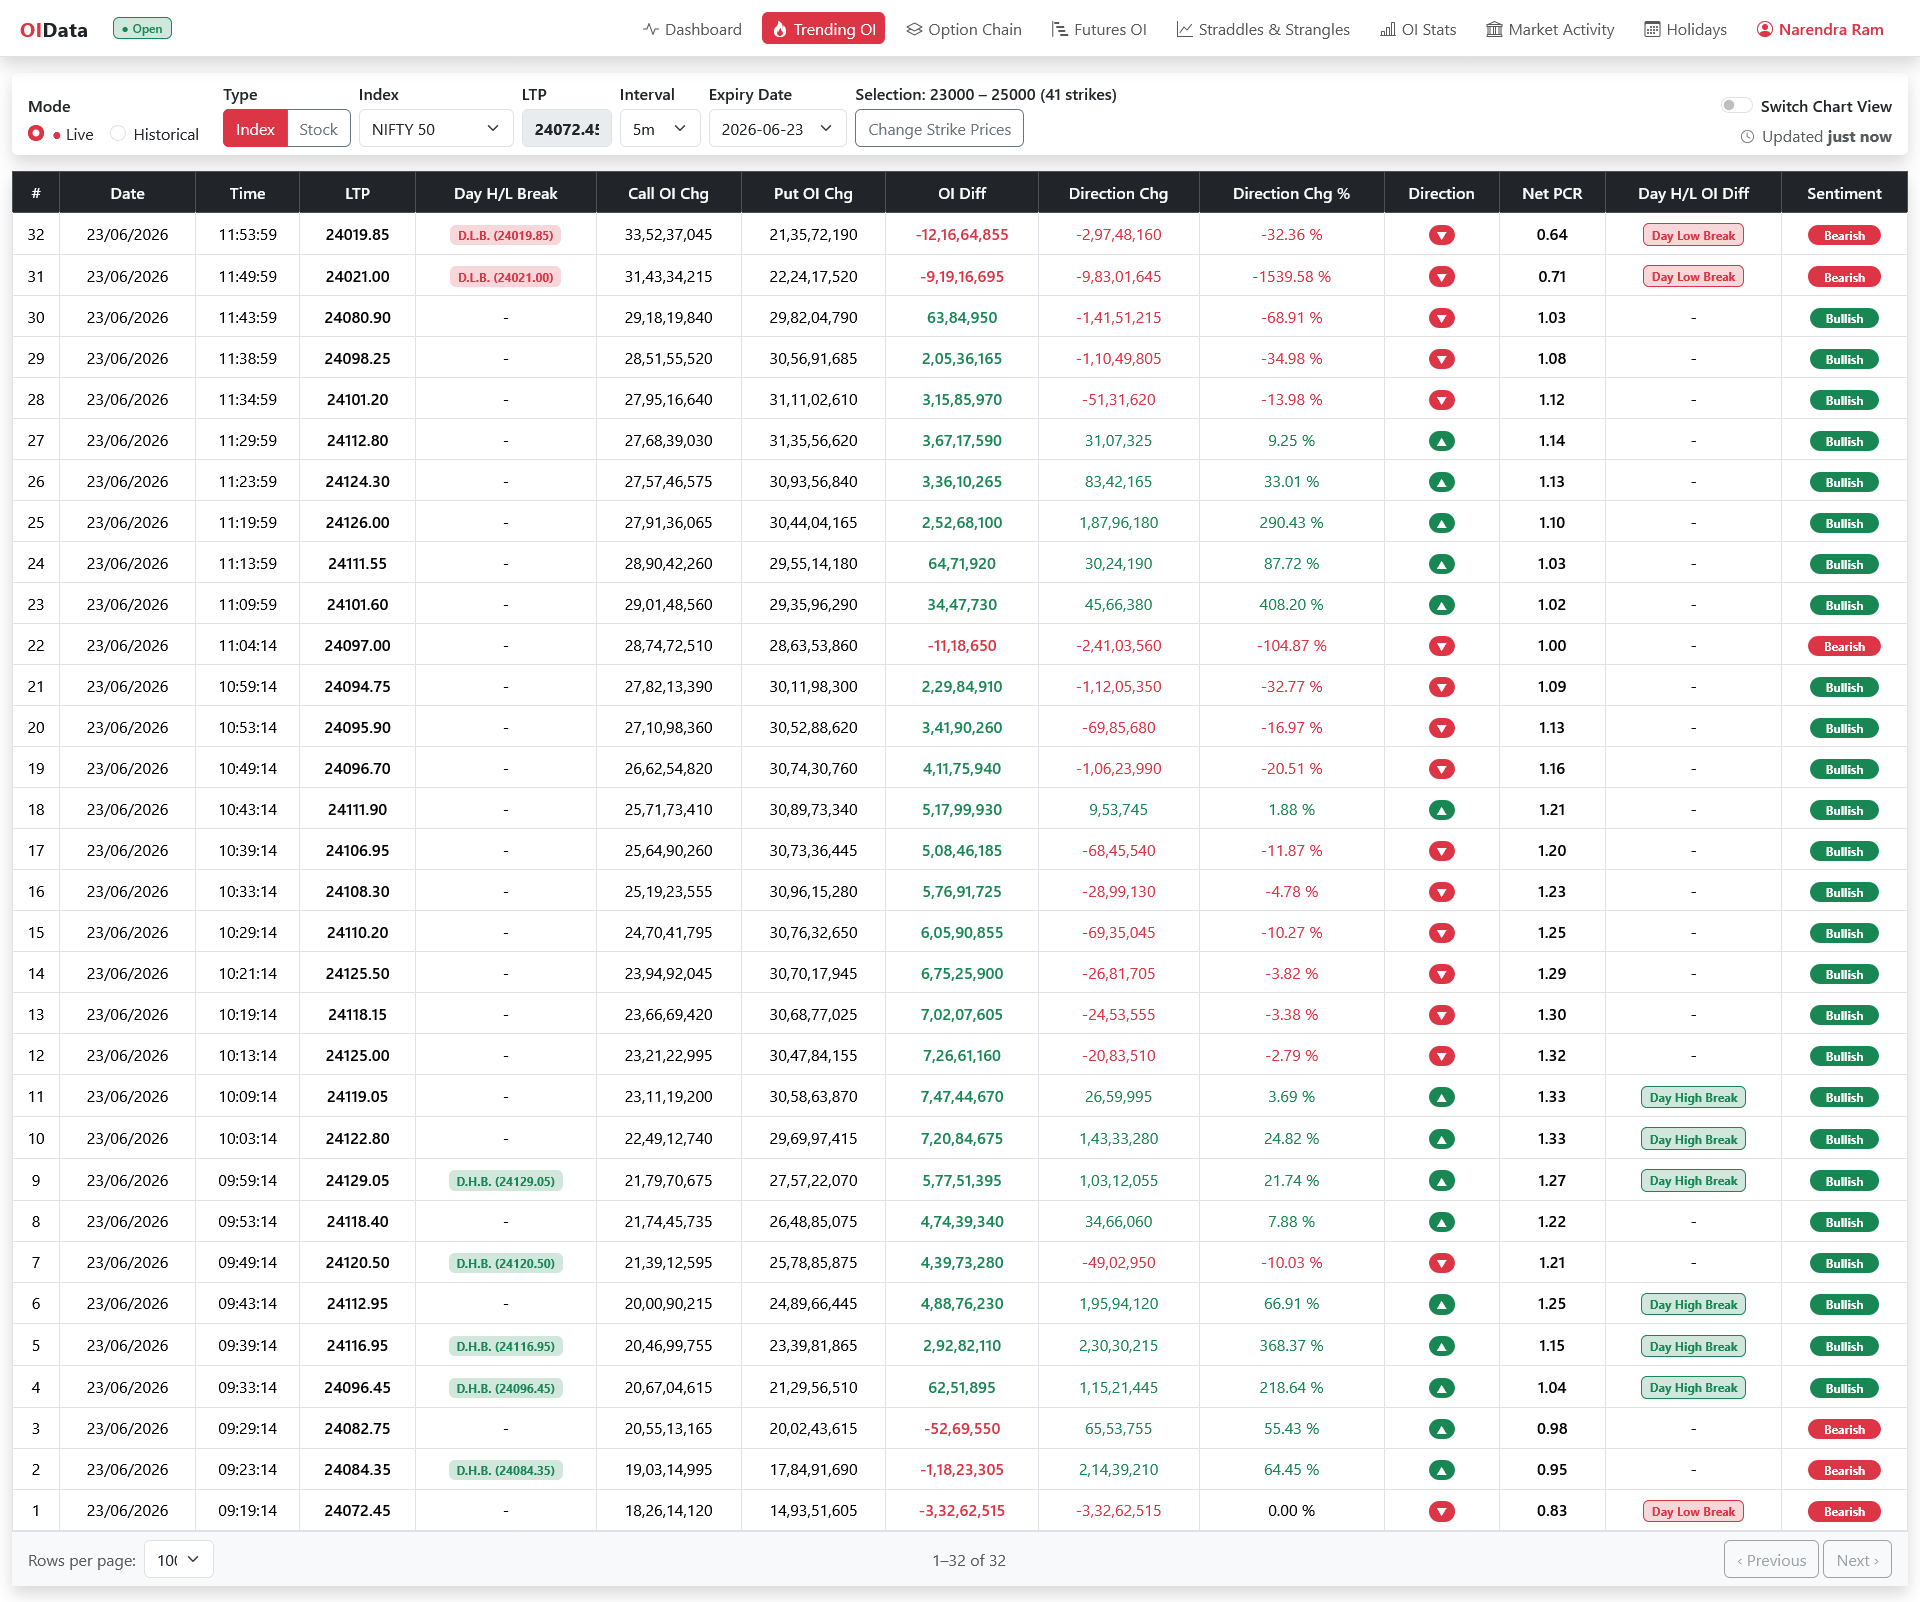
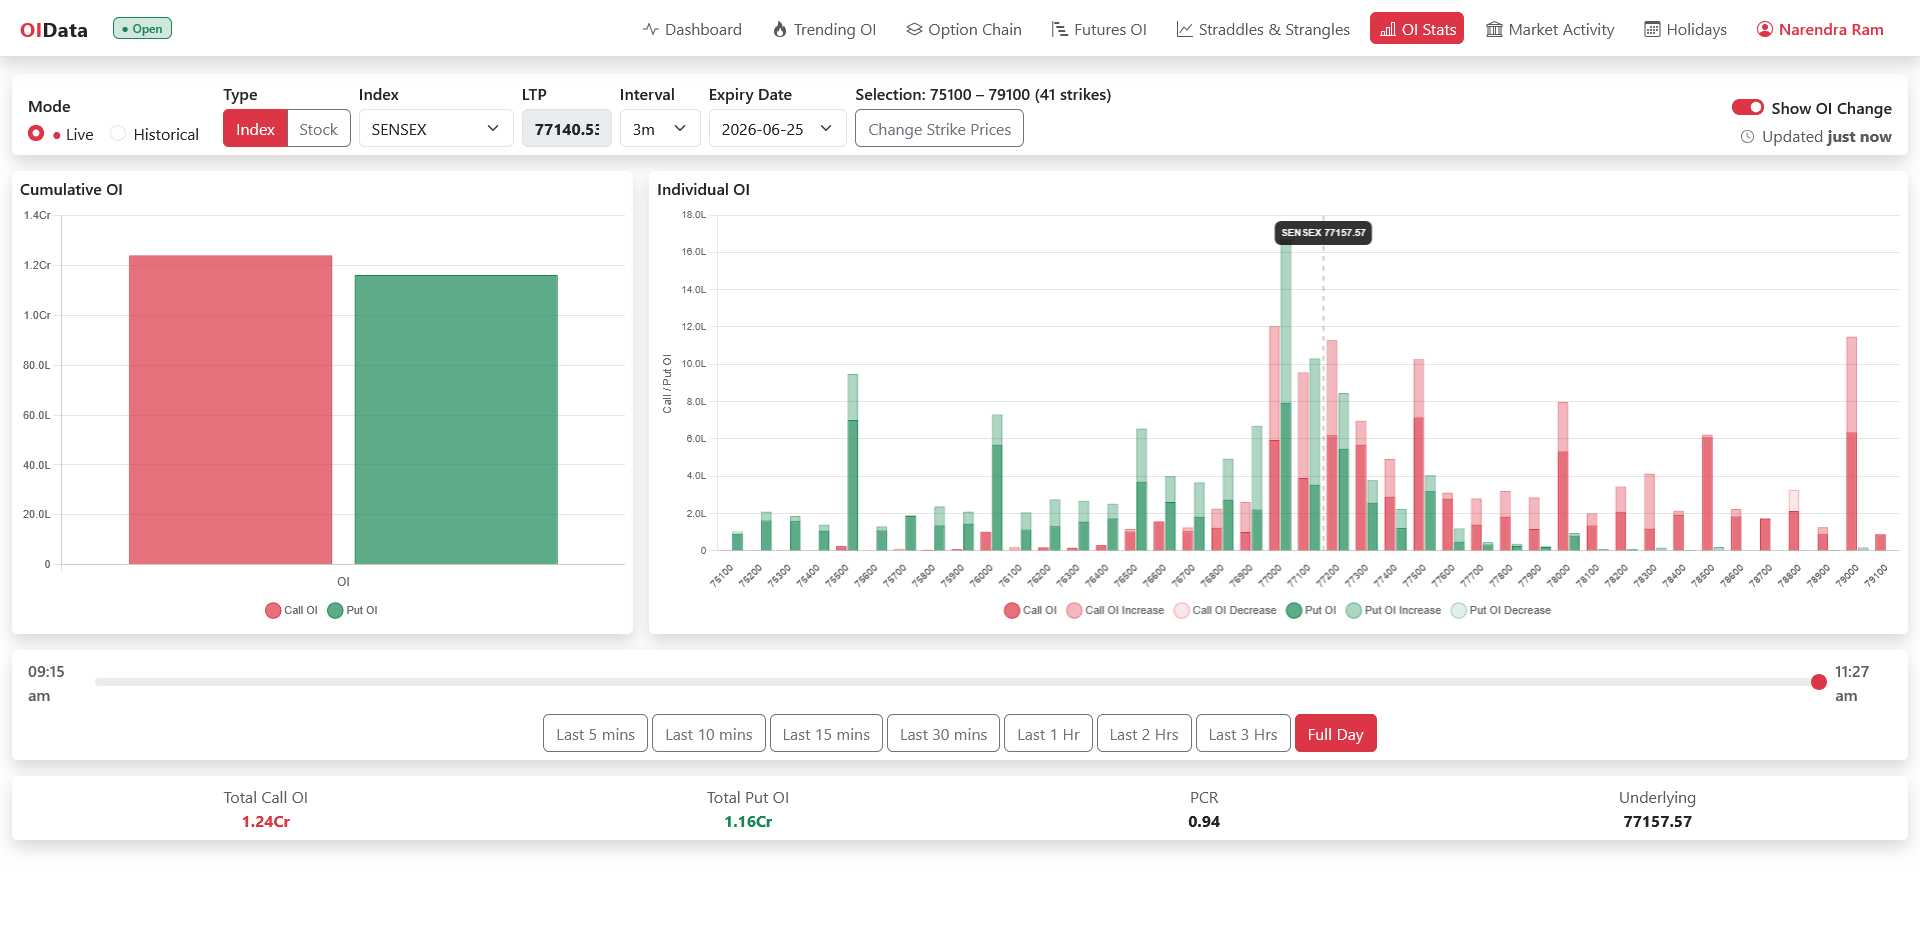
Track live open interest momentum
See how Call and Put OI shift across strikes in real time, with direction, net PCR, sentiment and automatic day high/low break alerts.
- Call vs Put OI change across selected strikes
- Direction, net PCR and sentiment per interval
- Day high/low breaks flagged as they happen
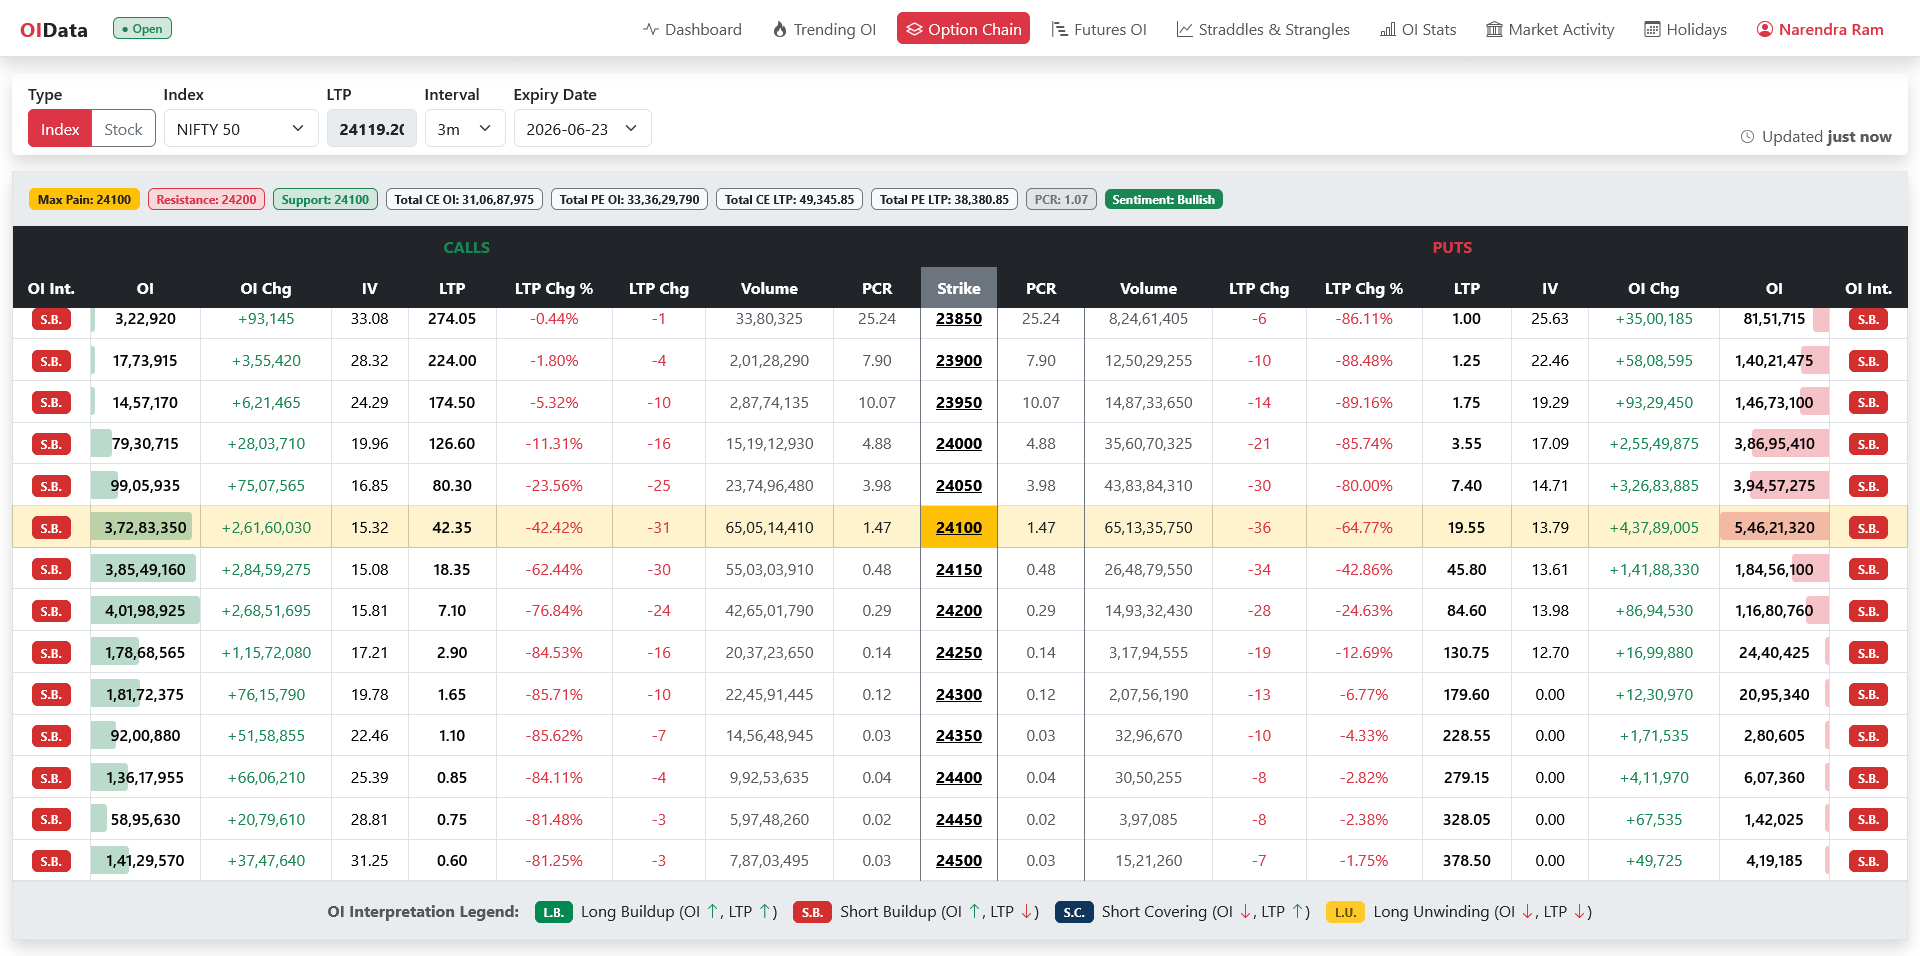
A compact, decision-ready option chain
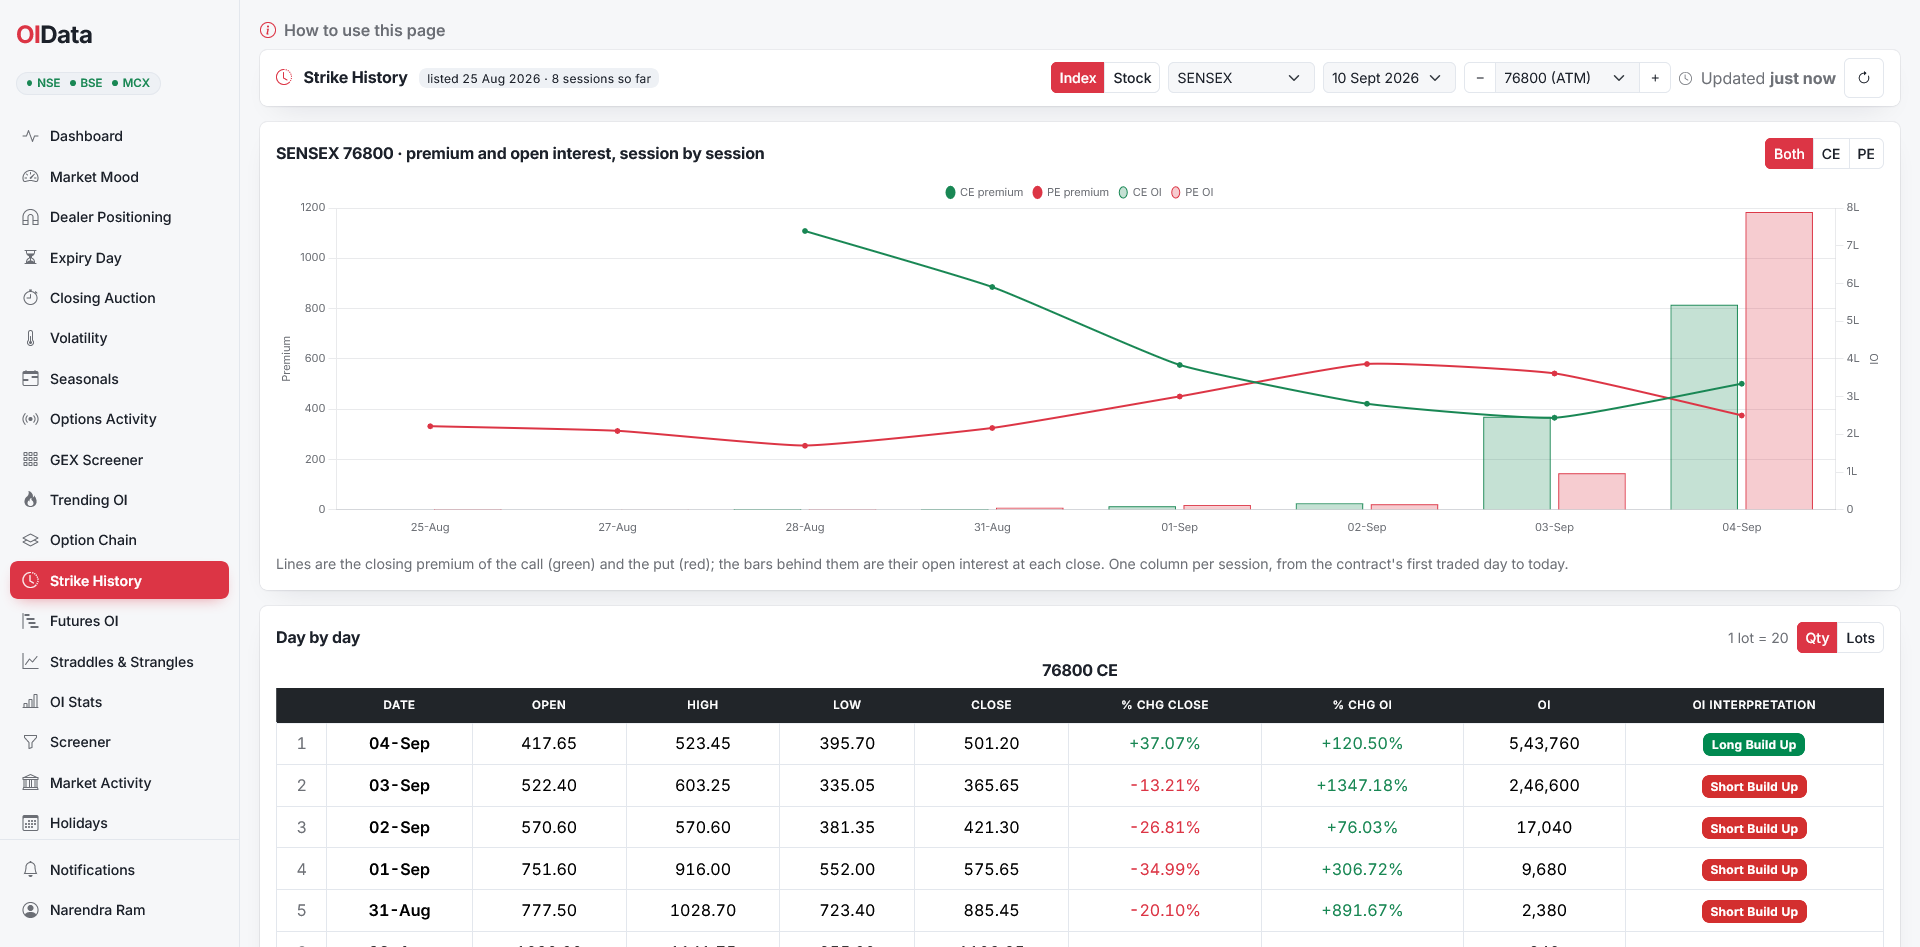
Strike-wise Calls and Puts with OI, OI change, IV, volume and PCR — plus max pain, support/resistance, built-in long/short build-up interpretation, a Replay mode that rewinds any recorded session minute by minute, and Strike History for any strike day by day from listing to expiry.
- Max pain, support and resistance highlighted
- Long/short build-up interpretation per strike
- Replay mode — scrub any session minute by minute
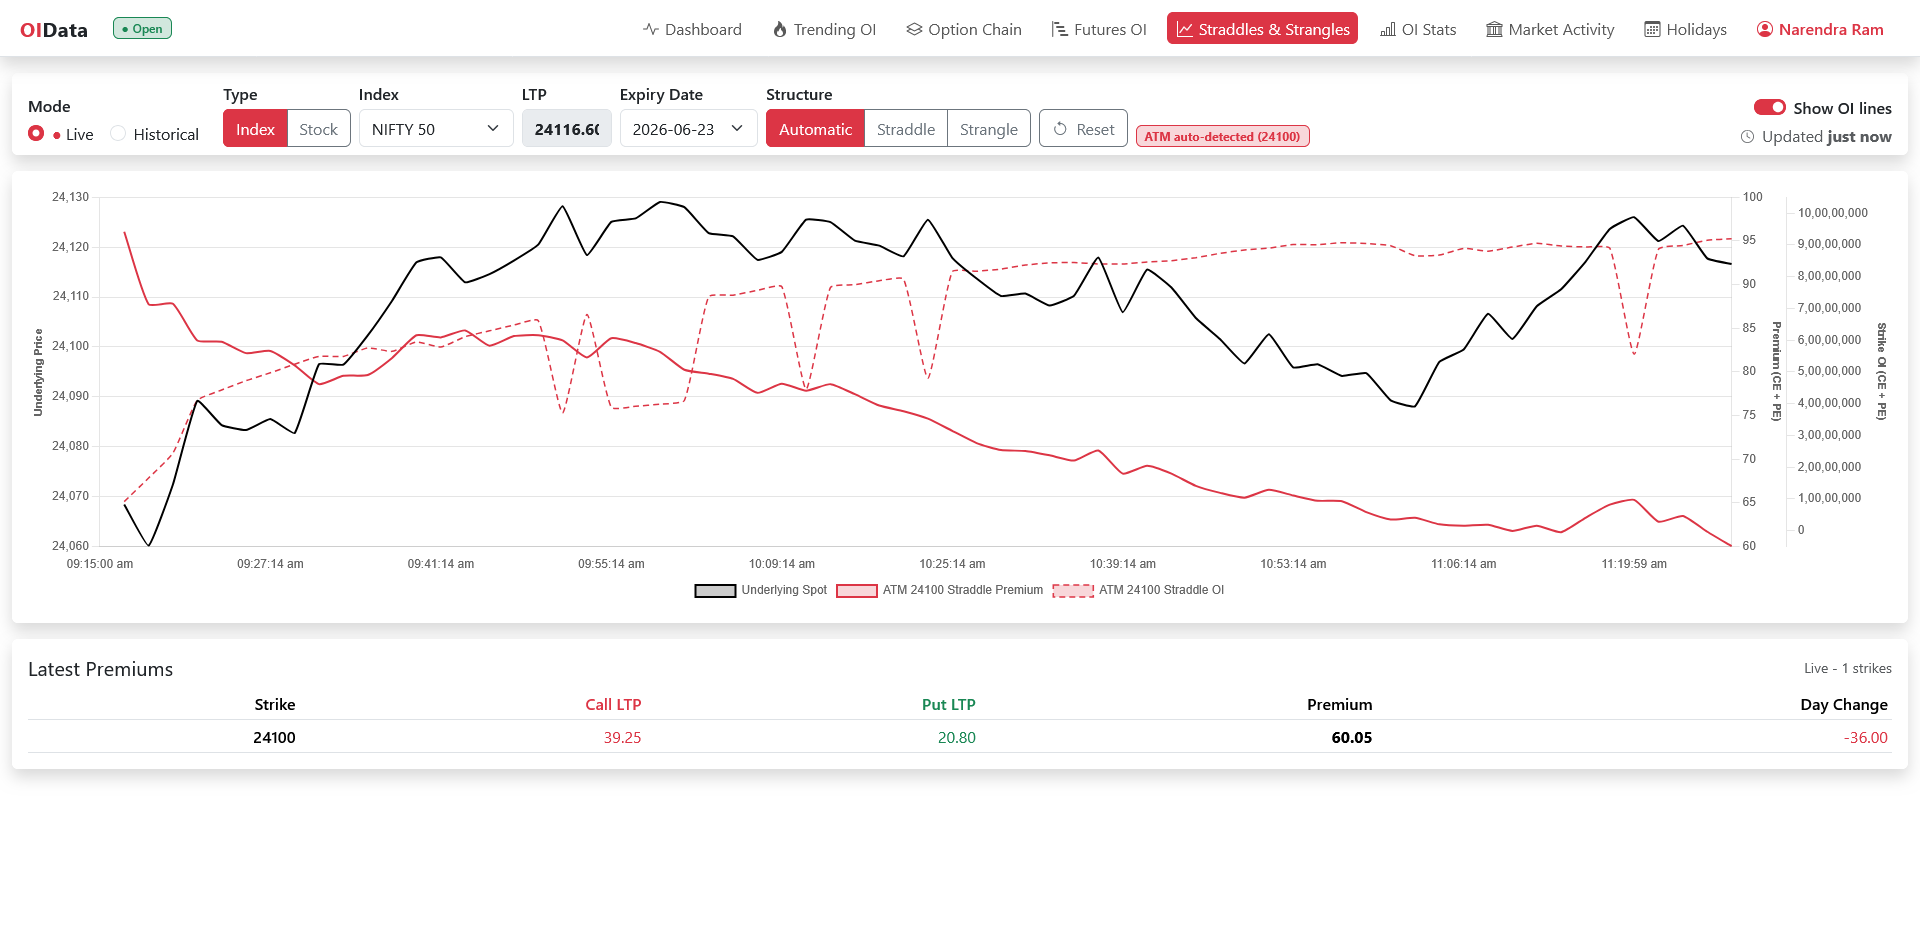
Watch premium move on straddles & strangles
Track ATM straddle and custom strangle premium through the day against the underlying spot and combined OI — ideal for premium-selling and decay strategies.
- ATM auto-detection with straddle and strangle modes
- Premium plotted live against the underlying spot
- Combined CE + PE open interest overlay
And more, included
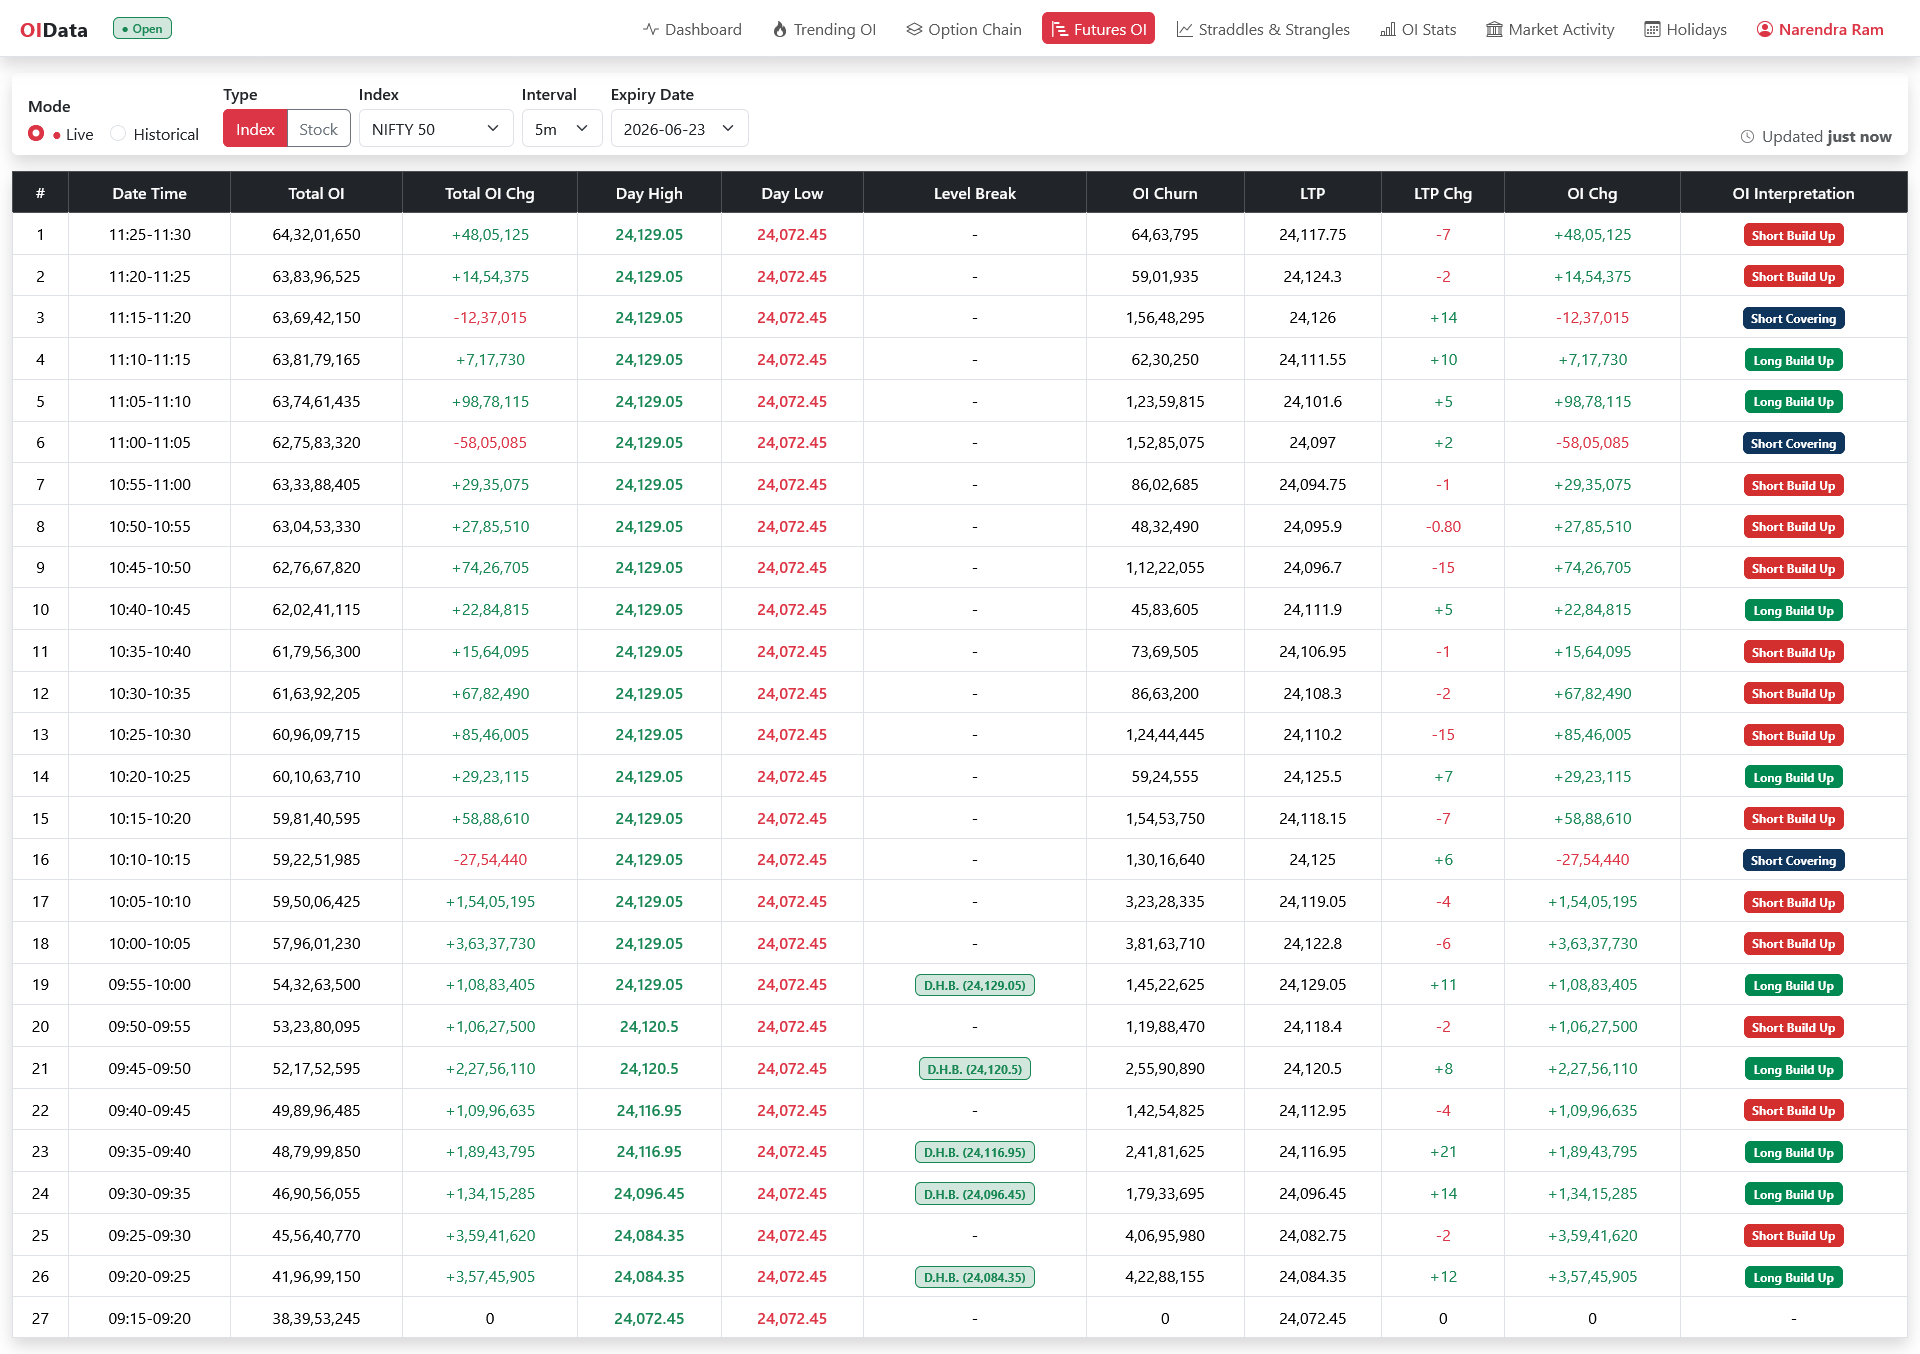
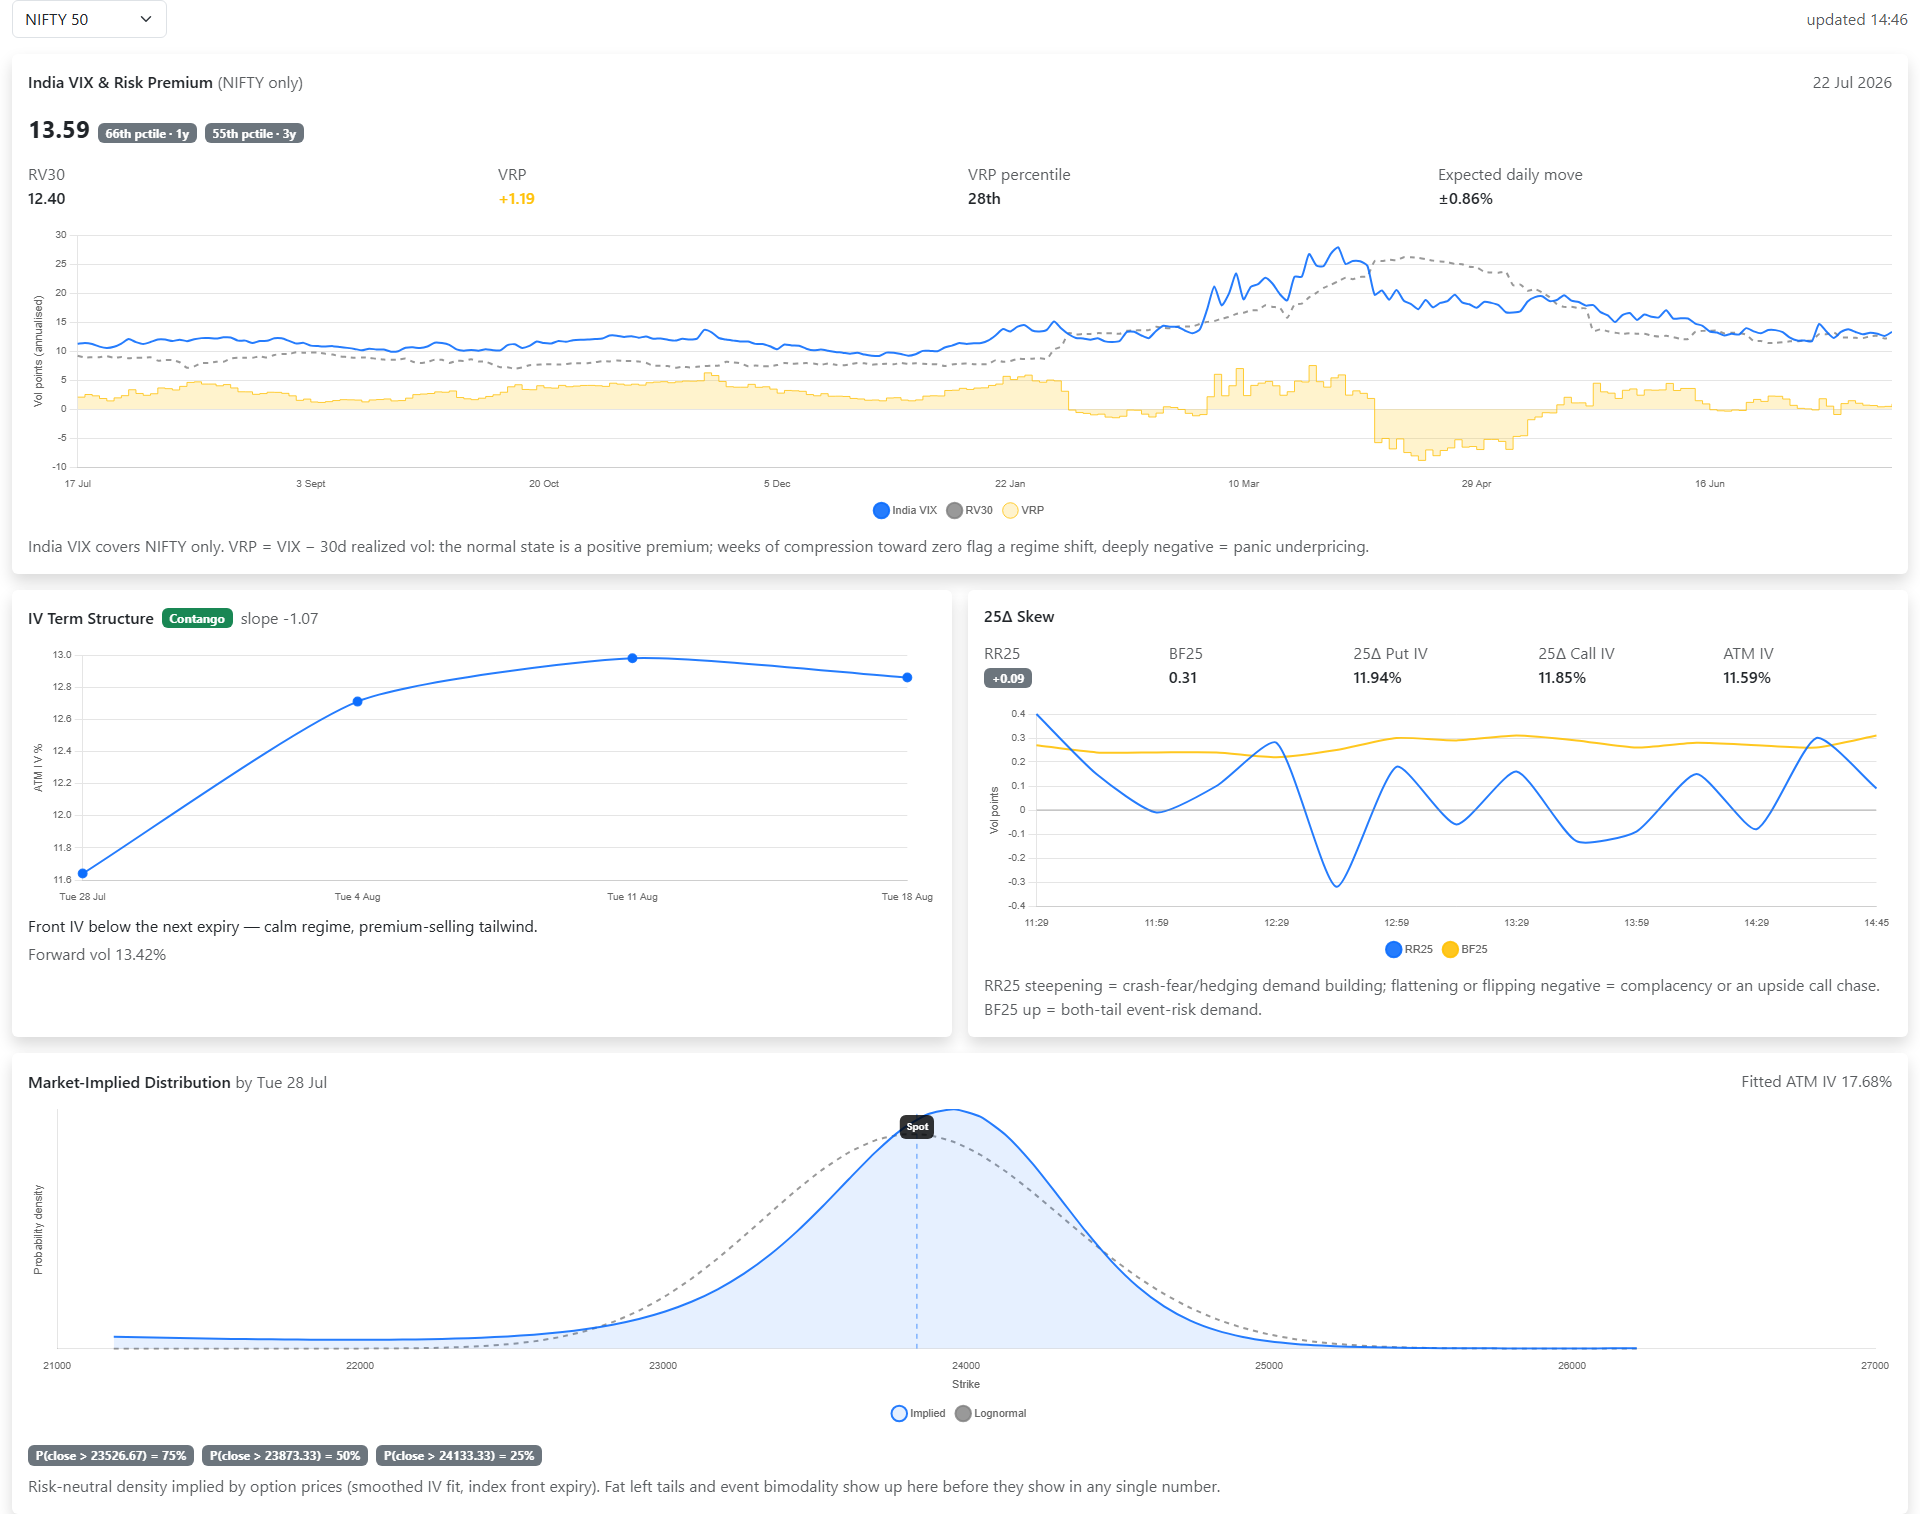
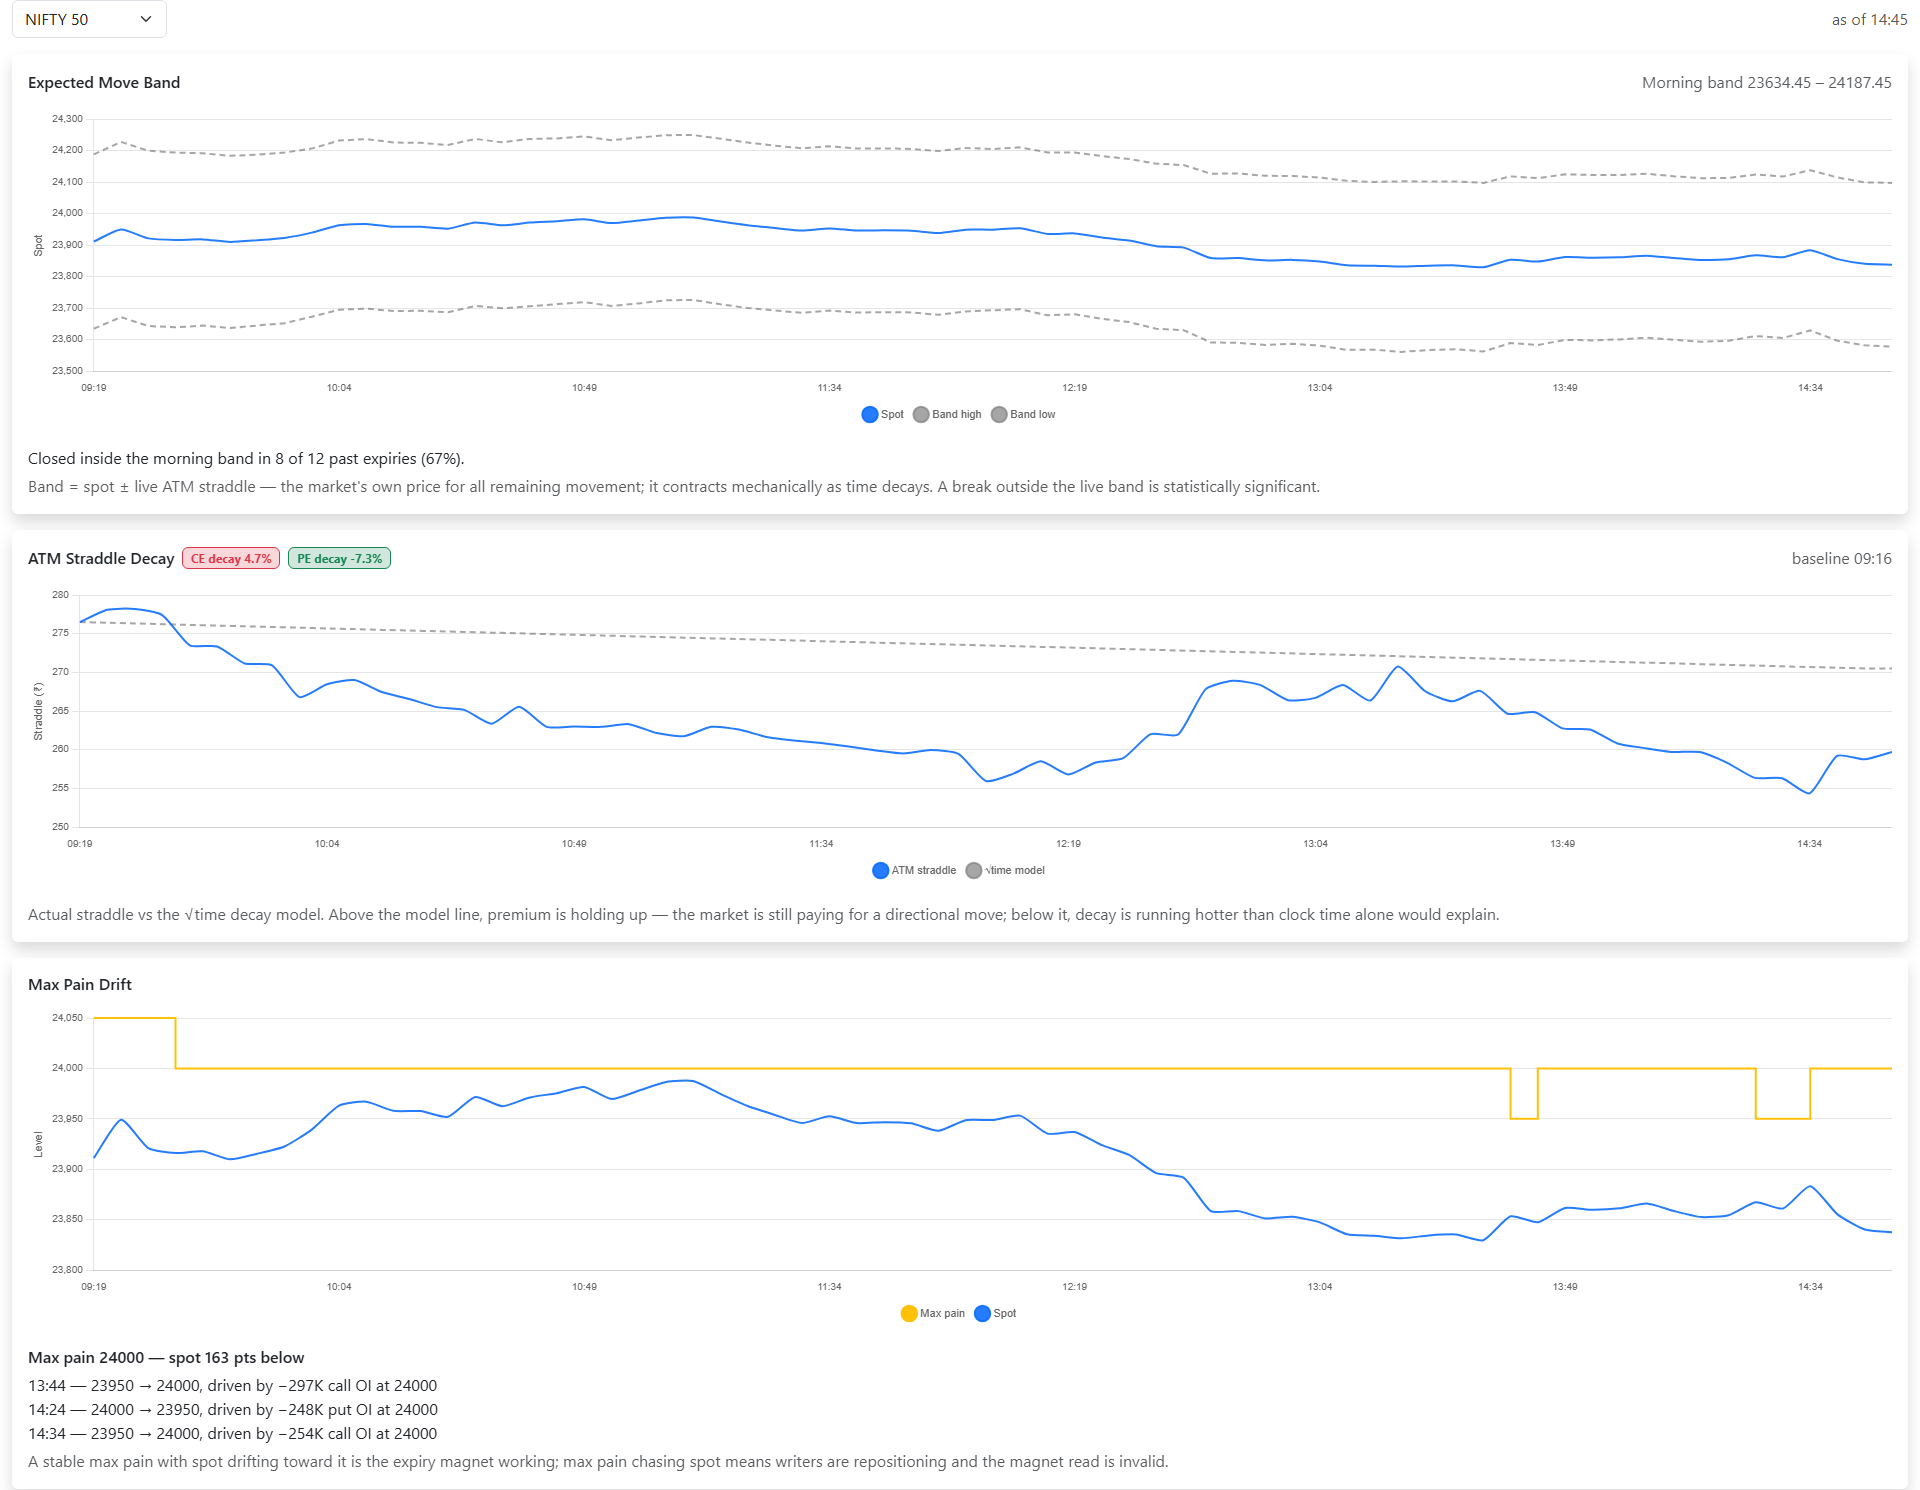
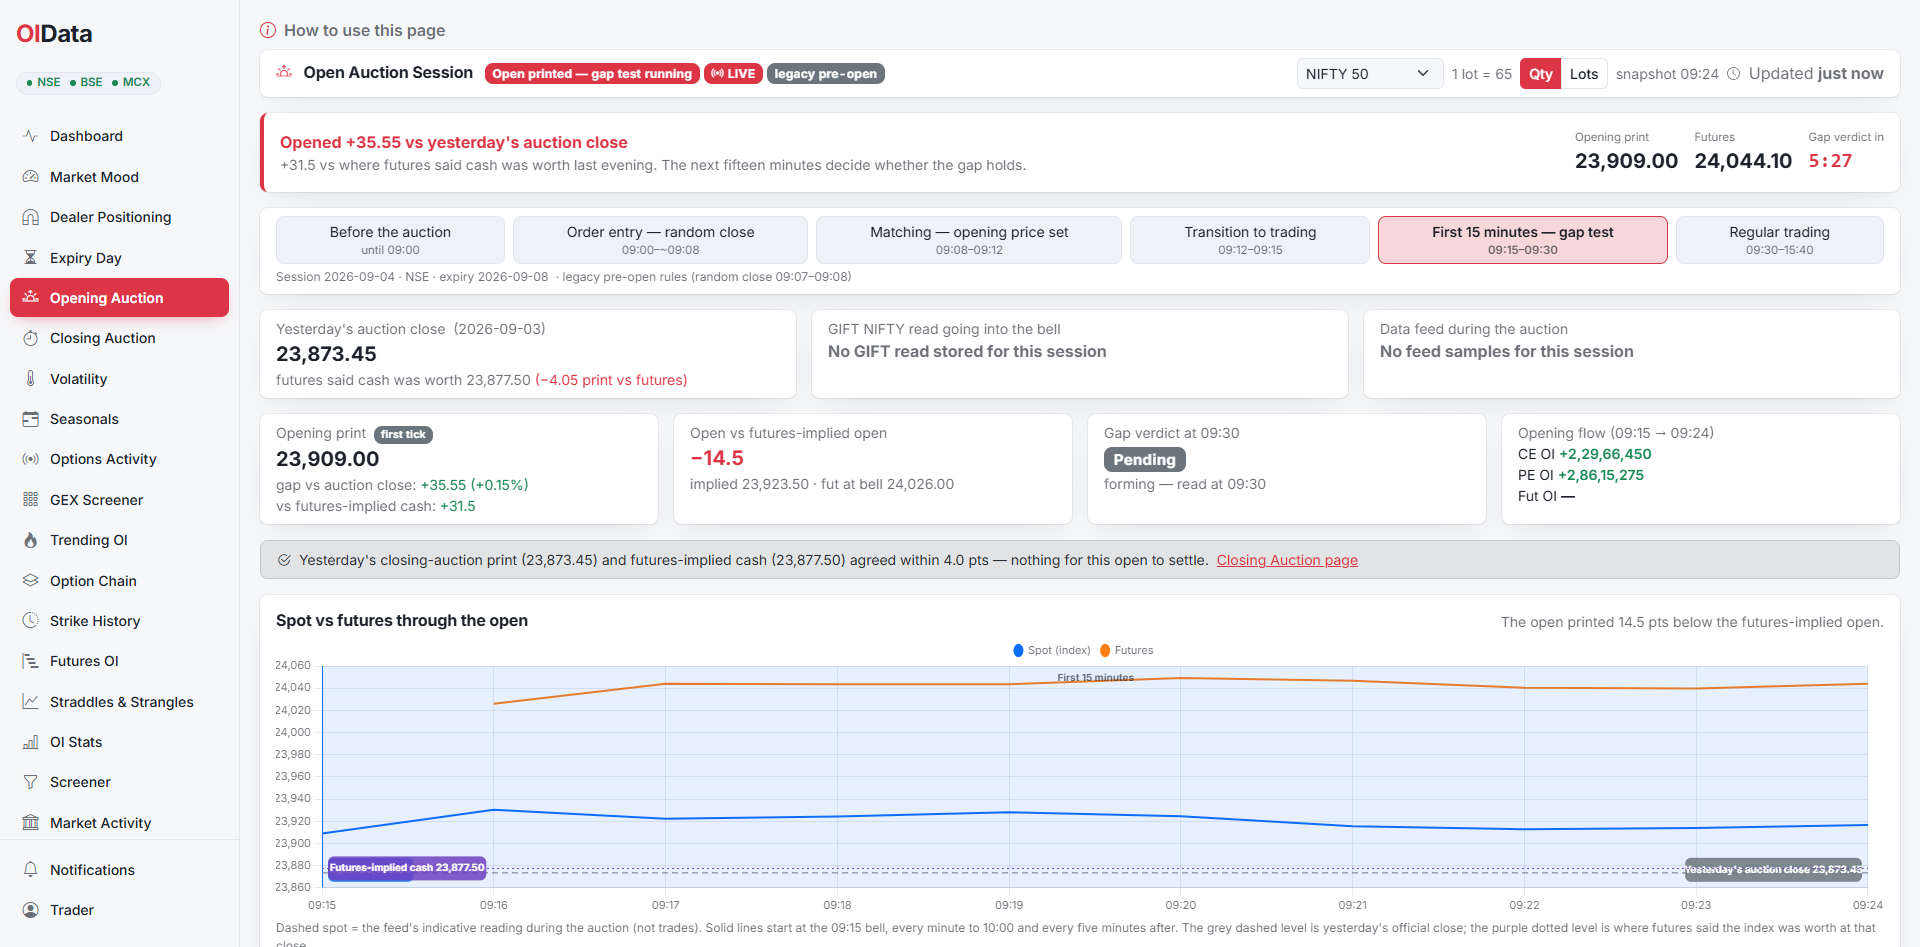
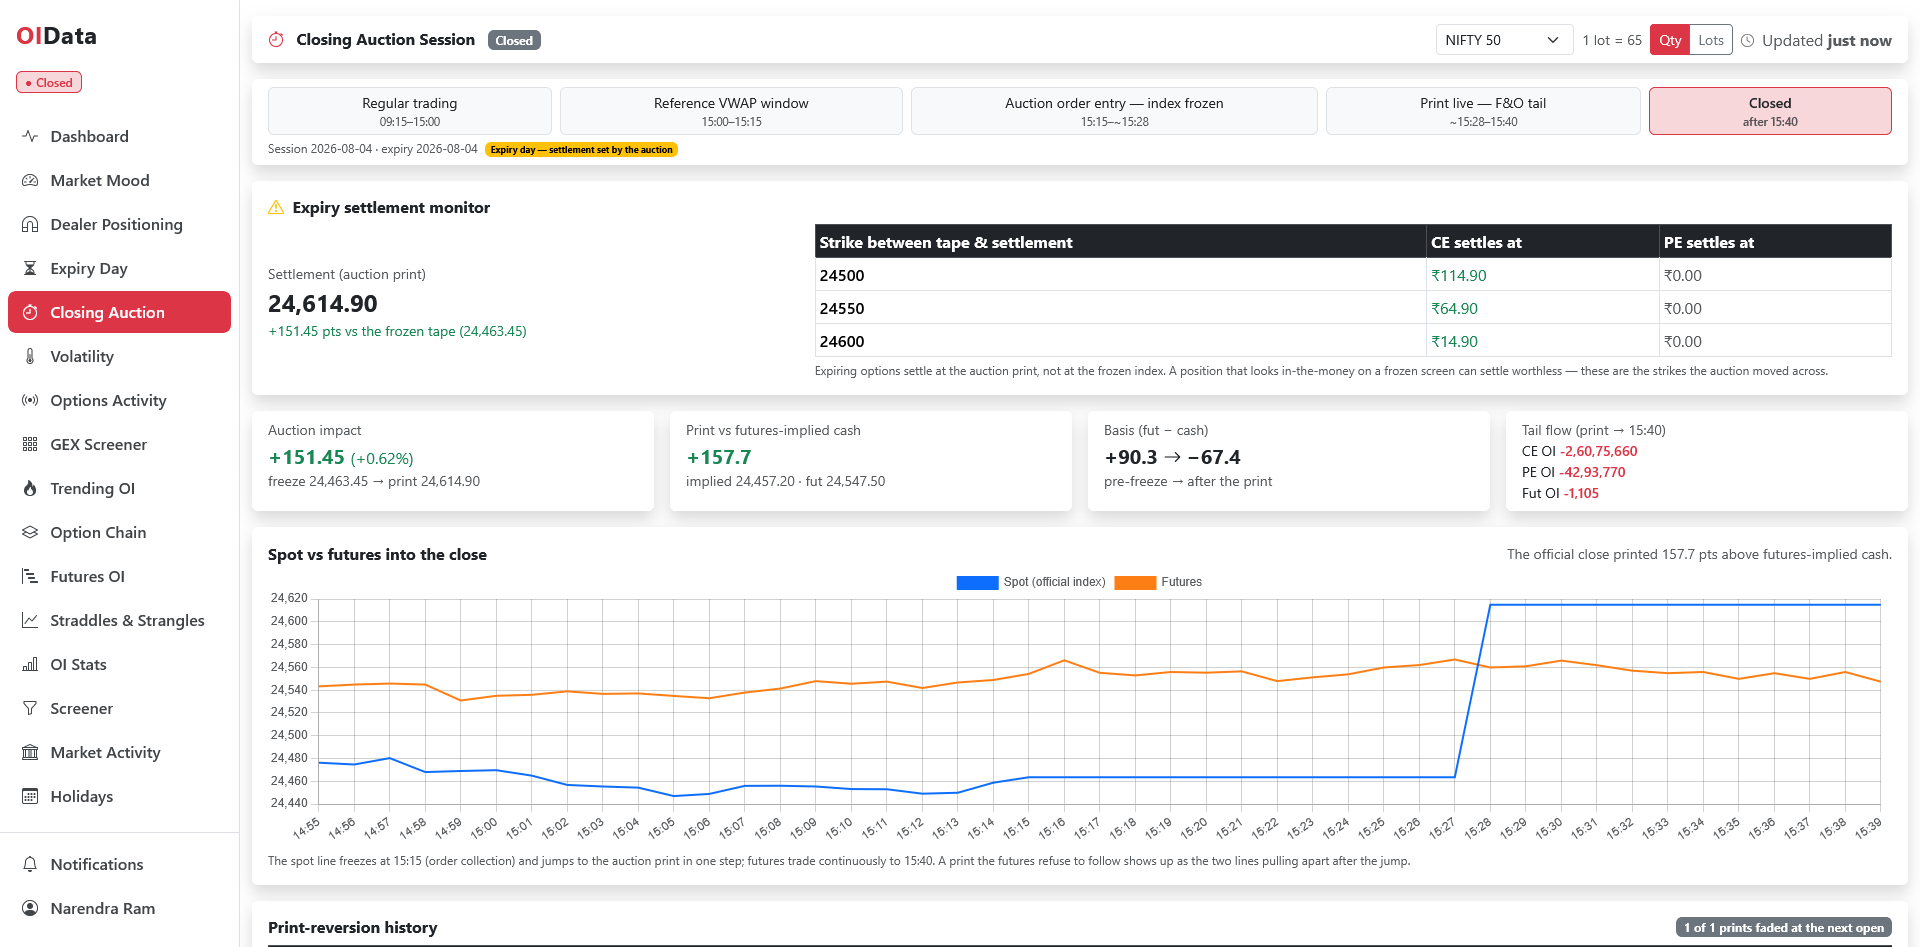
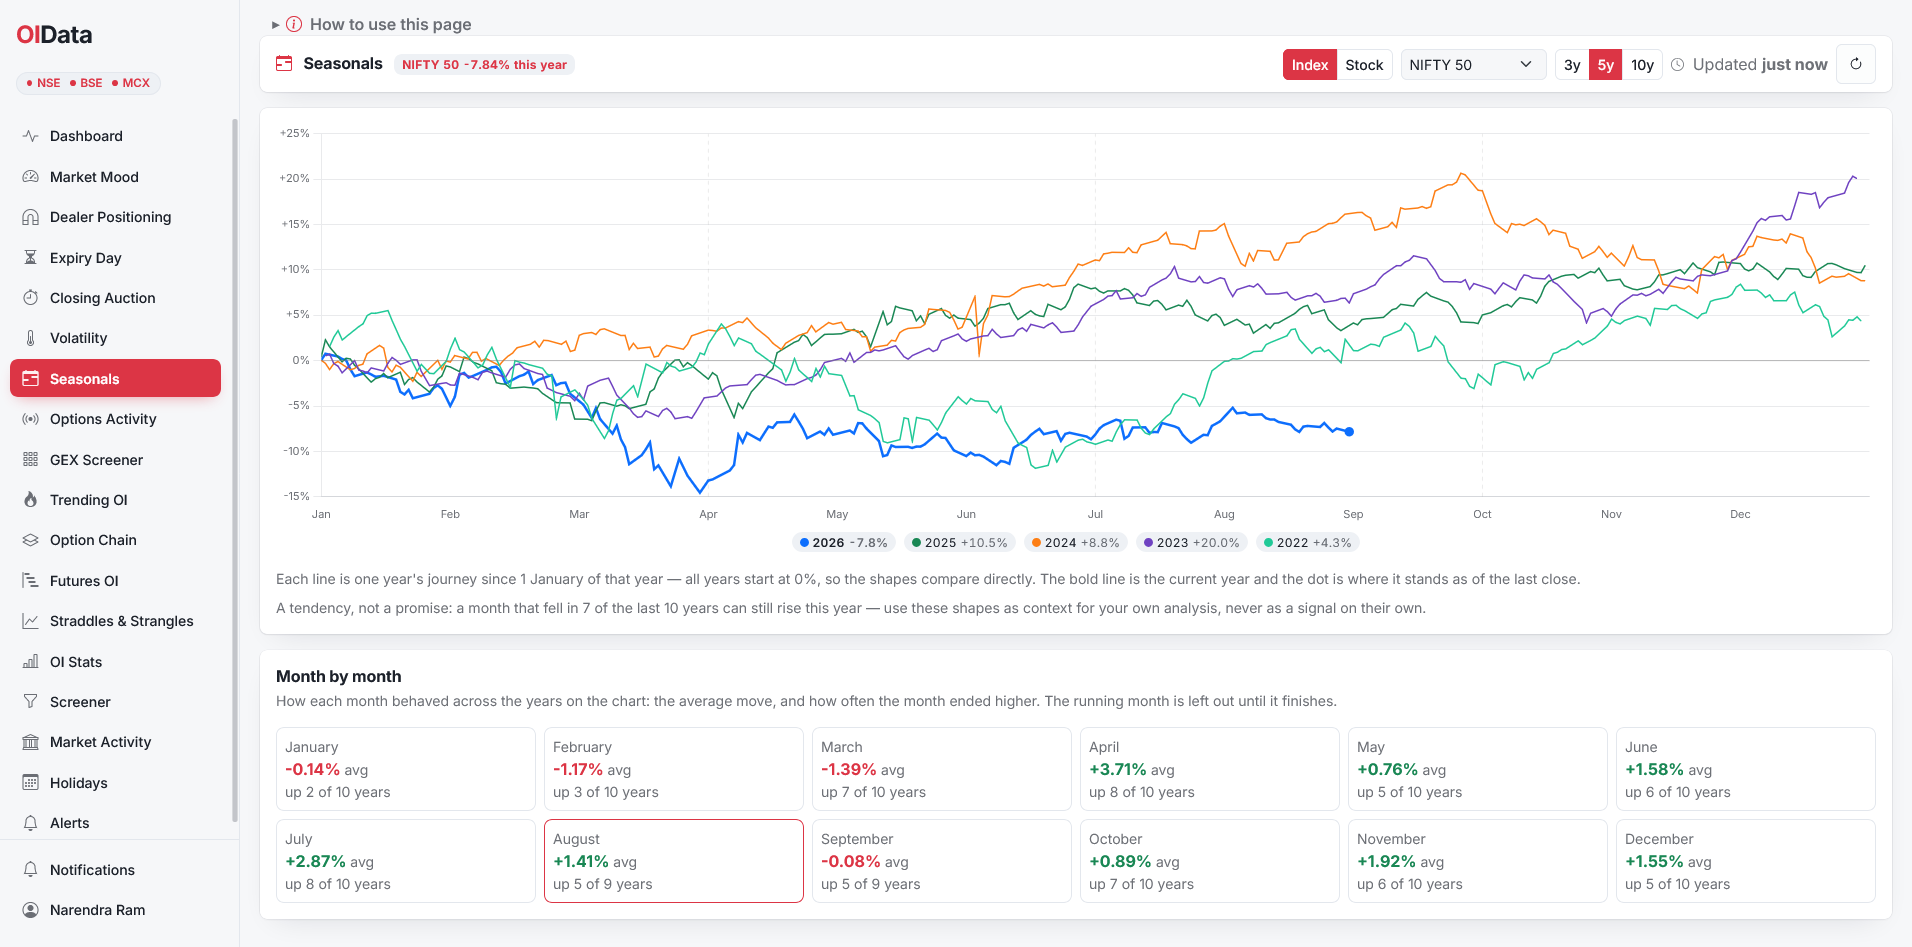
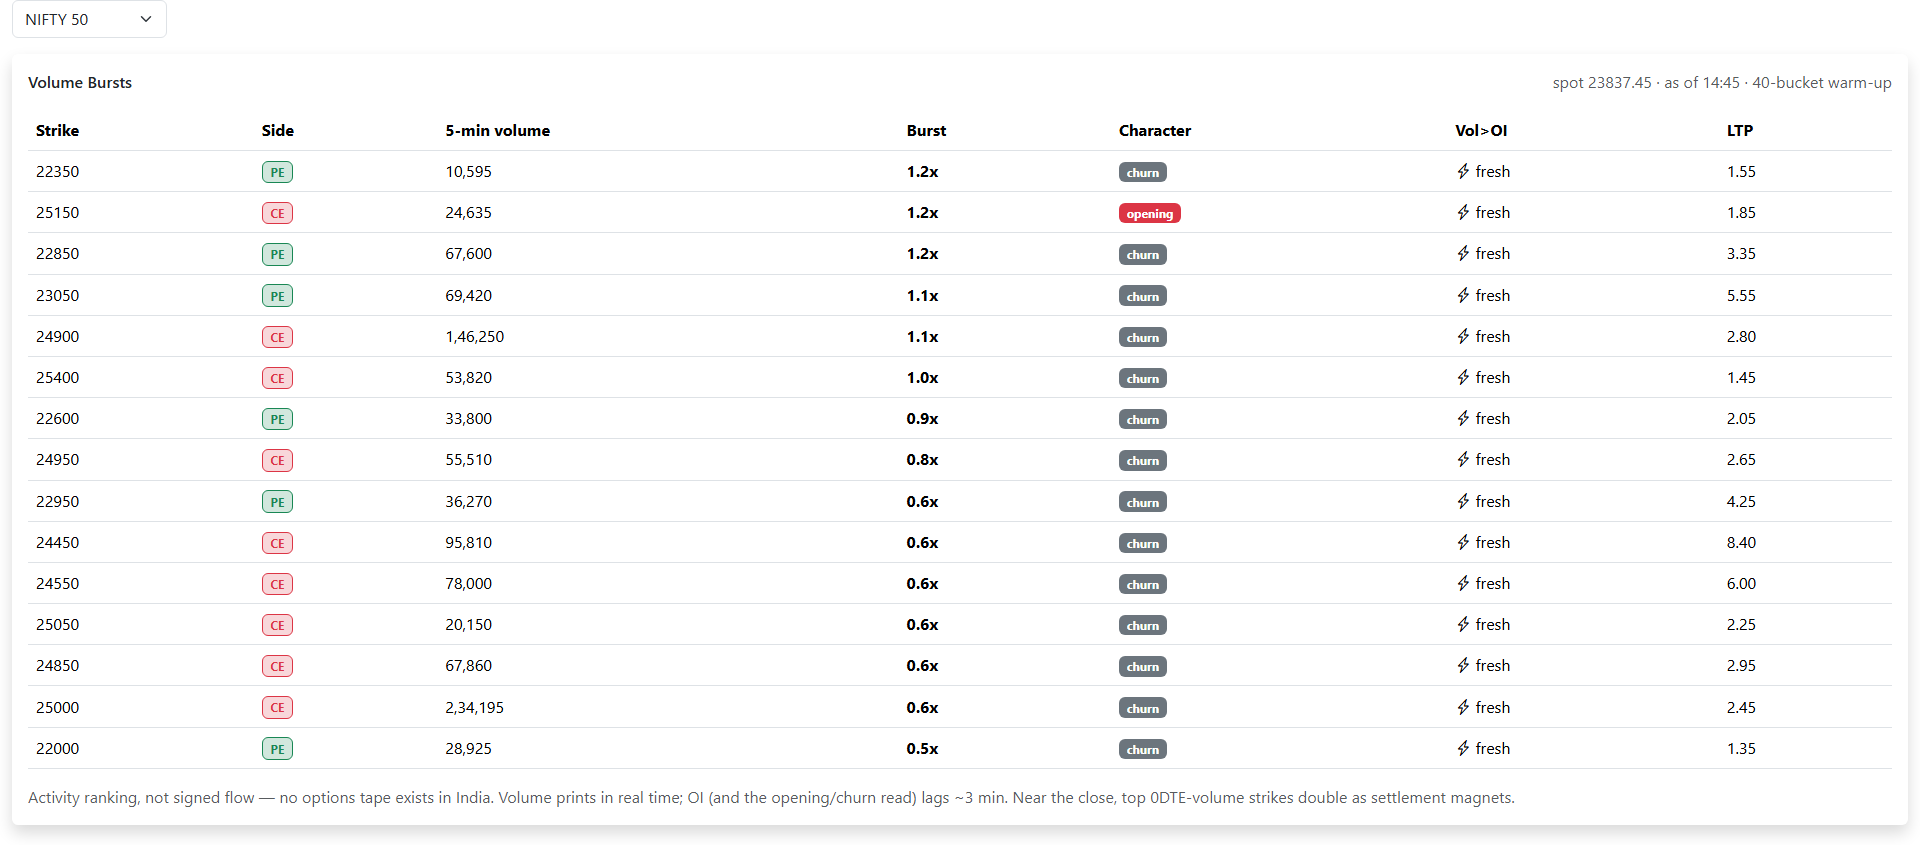
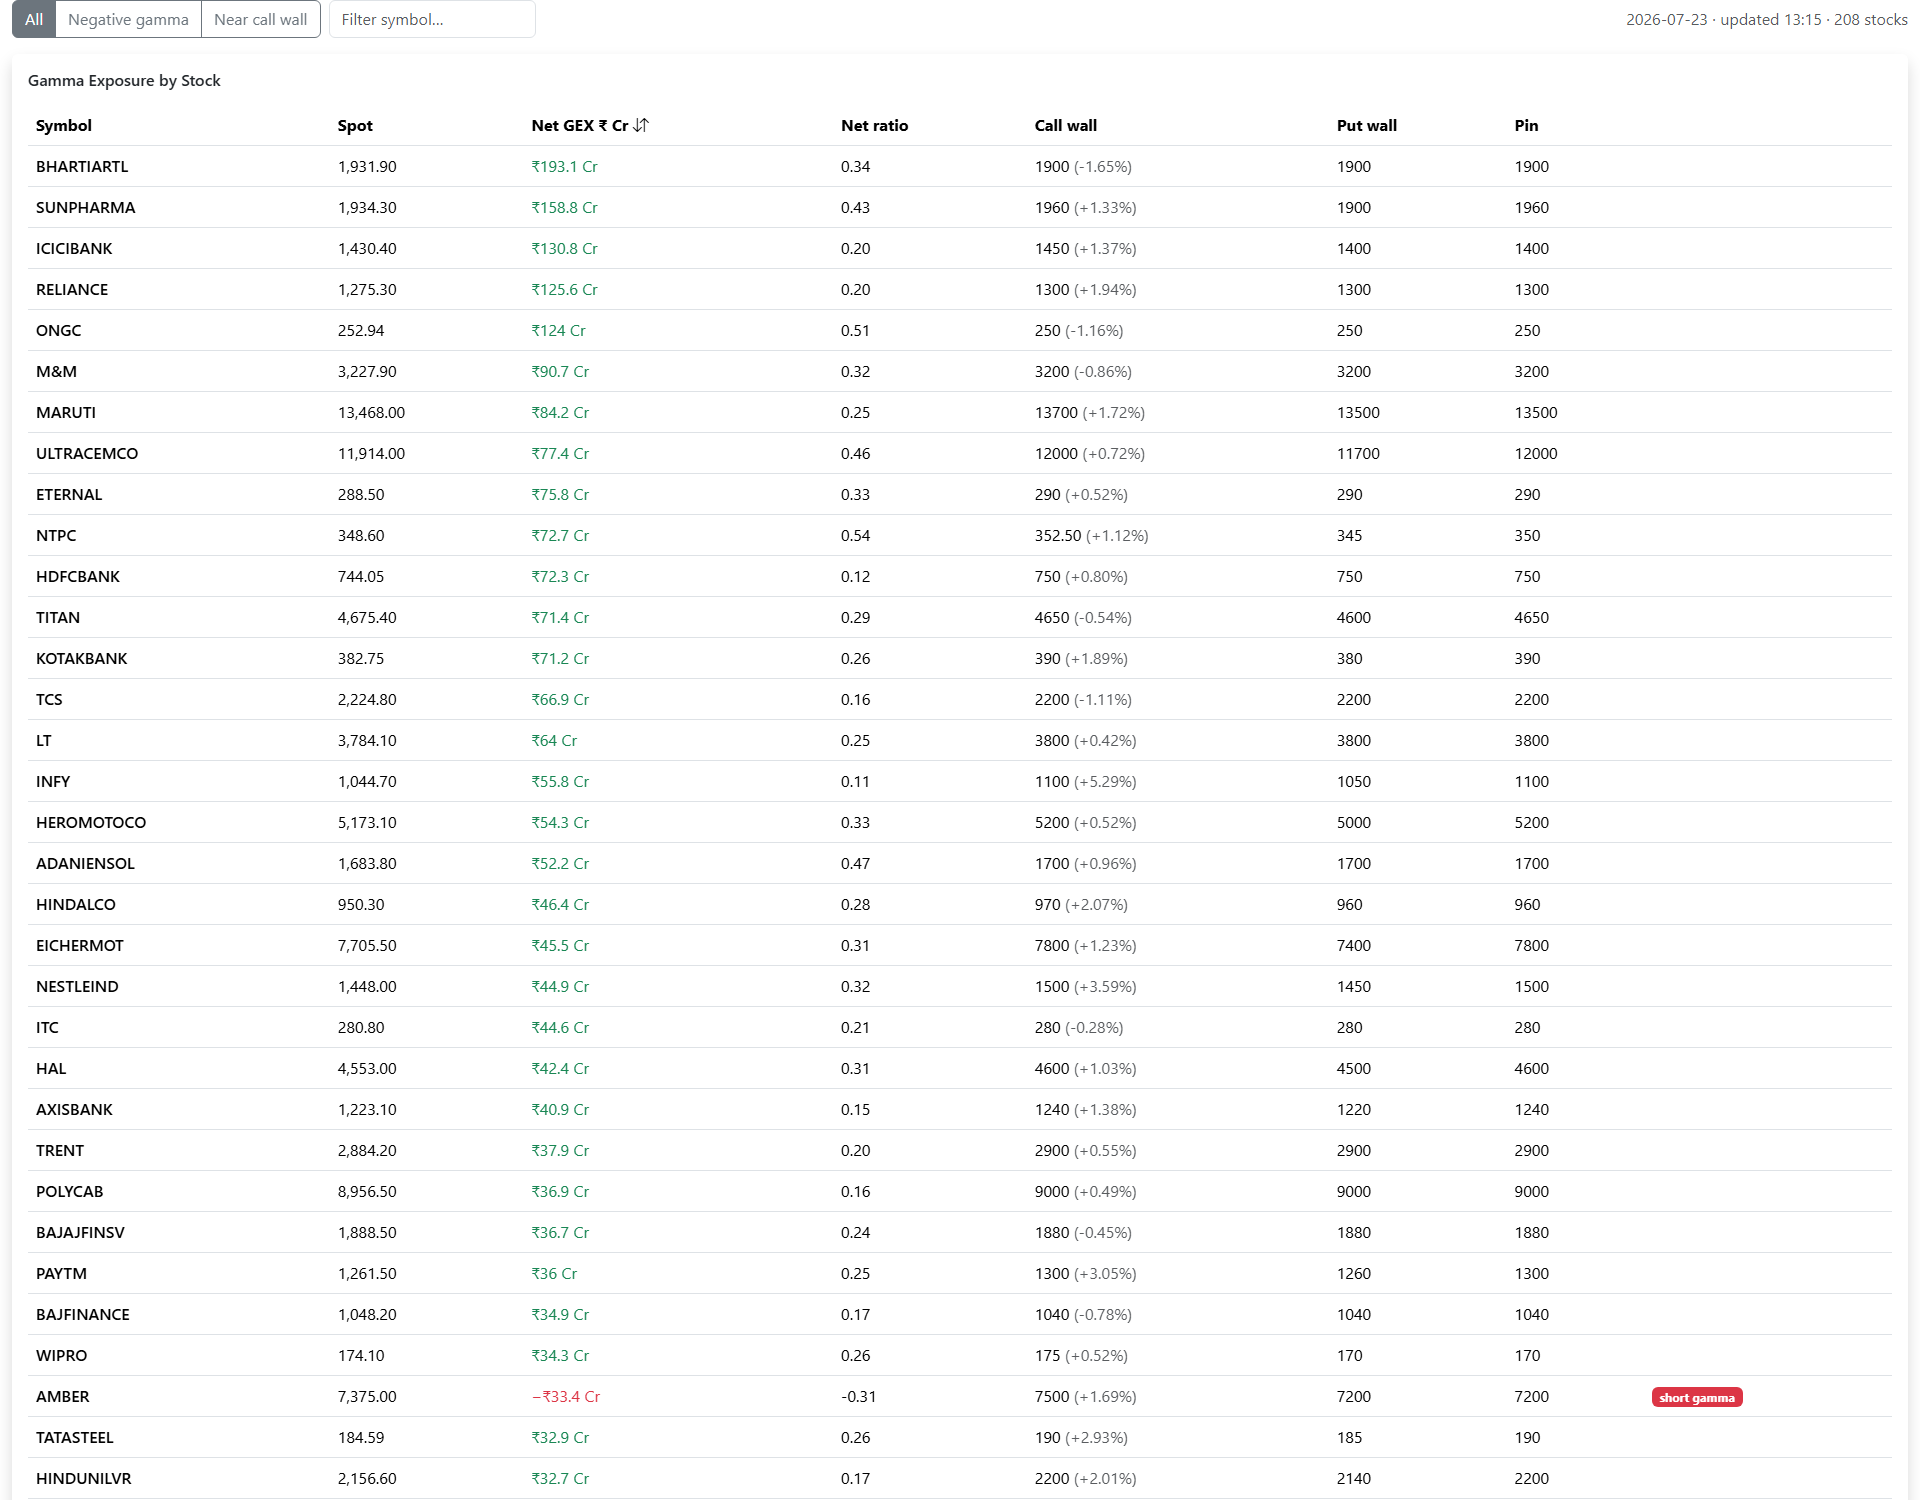
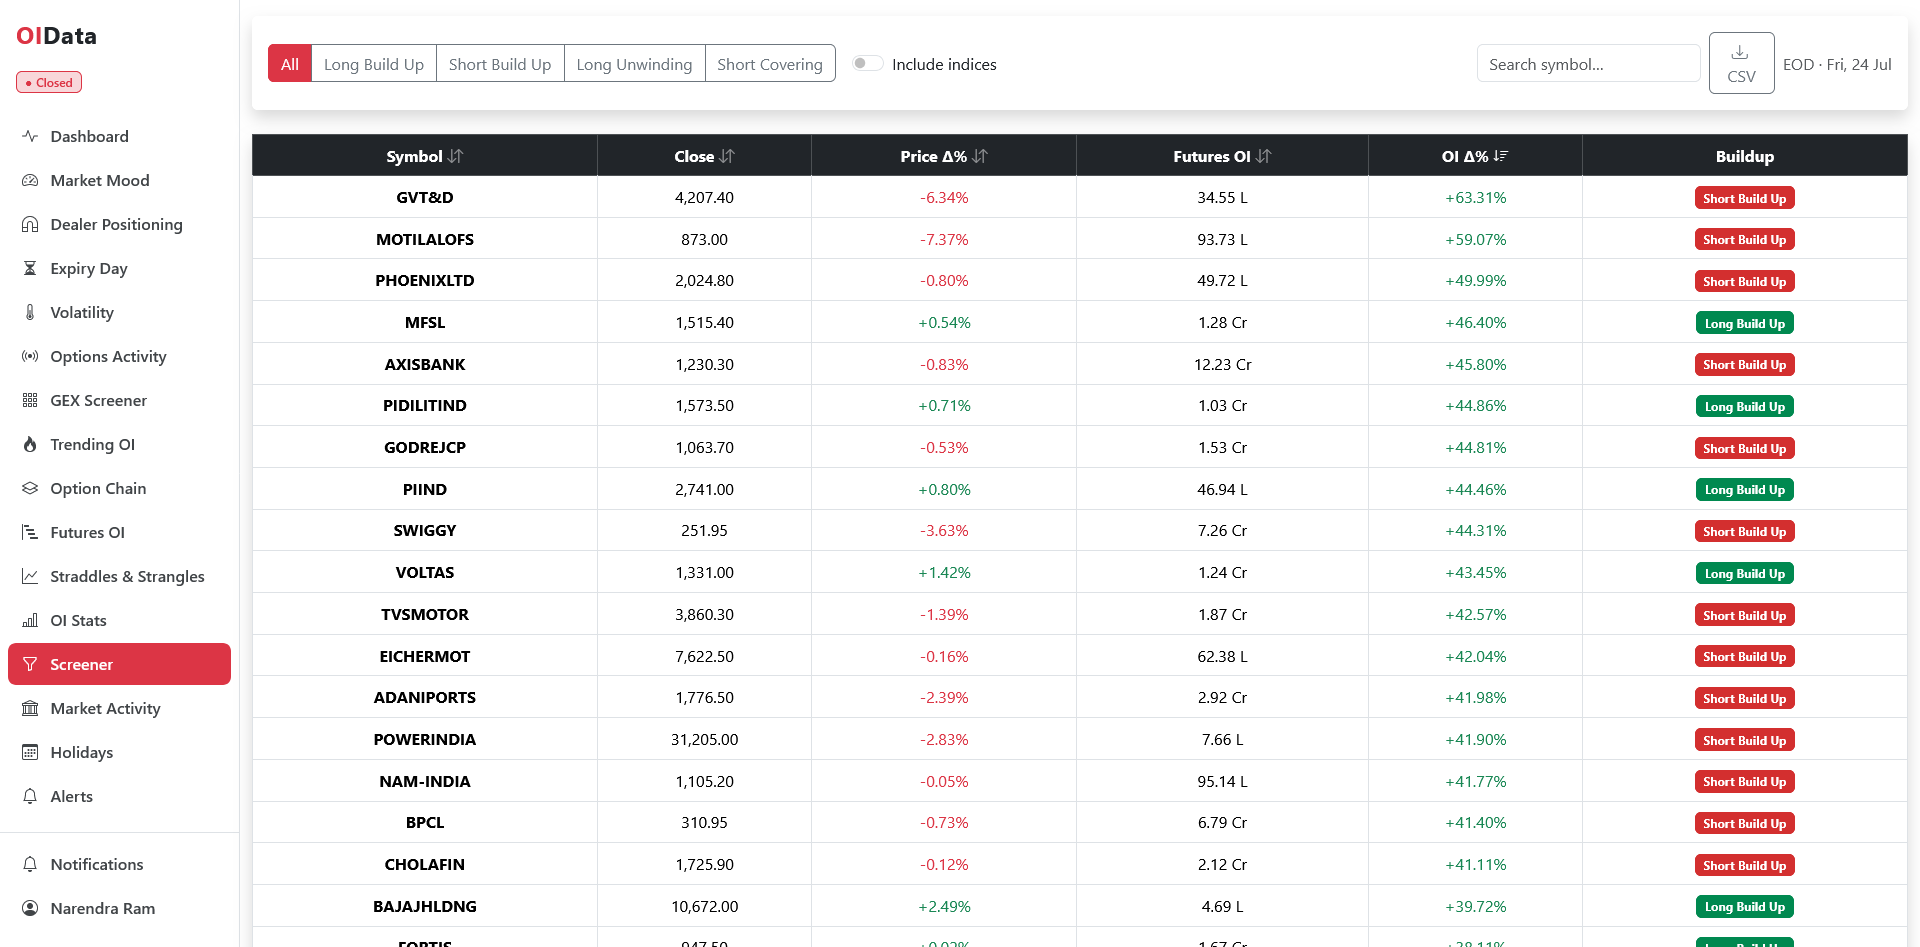
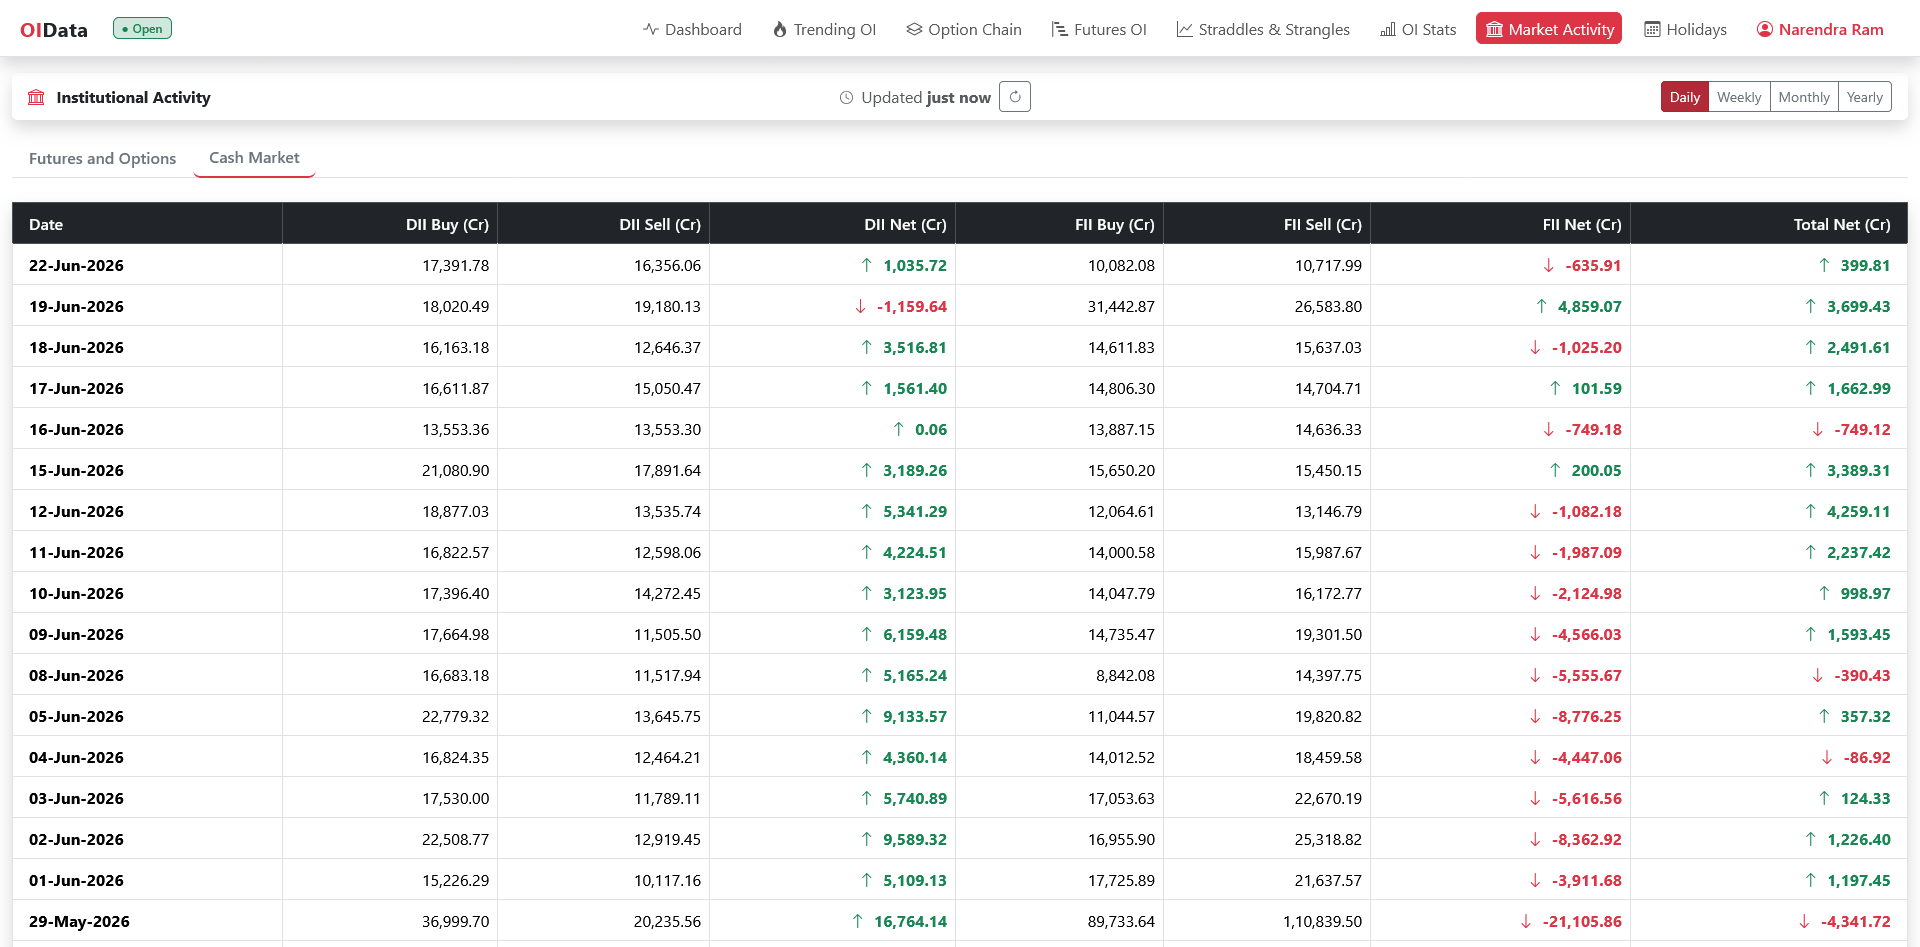
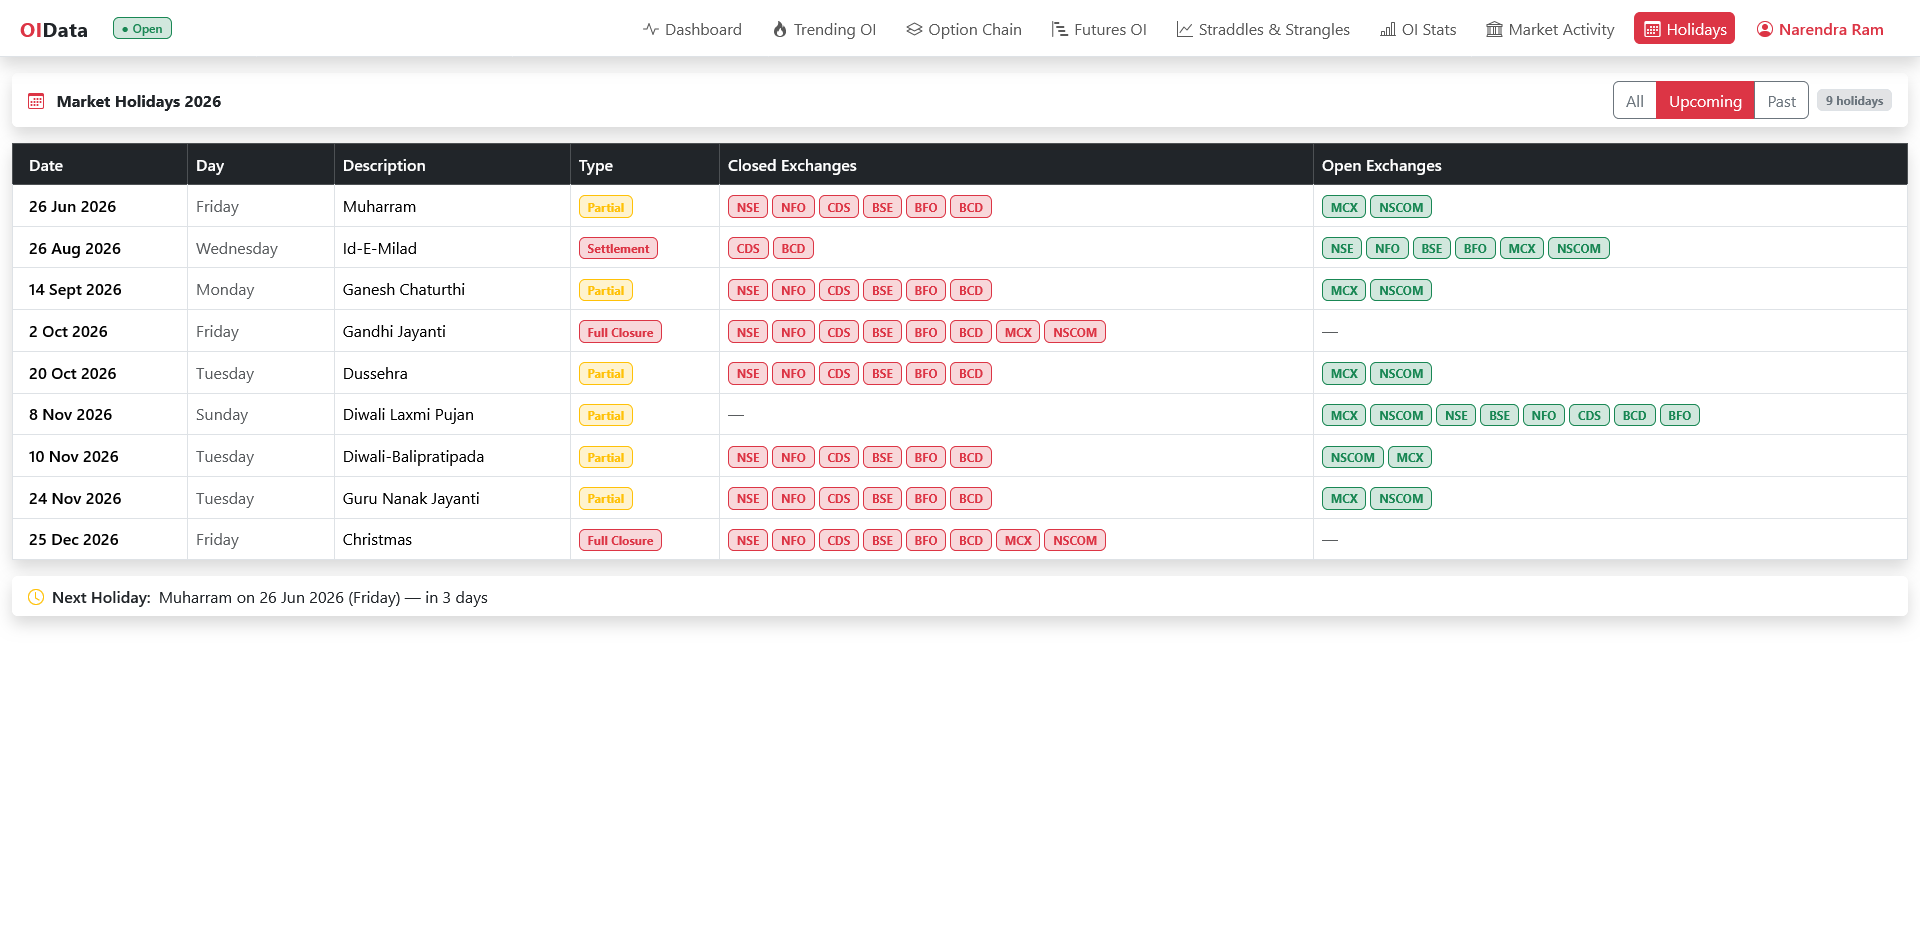
Volatility, Expiry Day, the Opening and Closing Auction trackers, Seasonals, Options Activity, the GEX and Buildup Screeners, Futures OI, OI Stats, Strike History, FII / DII Activity and the Holidays calendar round out the suite.
Up and running in three steps
Sign in, link your own broker account, and analyze — nothing to install.
Create an account
Sign in with Google in seconds. Nothing to install; it runs in any browser.
Choose your view
Pick an index or stock, the expiry, time interval and the strikes you want to track.
Read the data
Watch live OI changes, PCR, sentiment and day high/low breaks — then decide for yourself.
Bring your own broker — 30 supported
You connect with your own broker API key — market data streams straight from your own SEBI-registered broker account into the analytics. Broker connections are being enabled in phases, and OIData never places orders or enables trading.
 Zerodha
 Groww
 Upstox
 Angel One
 Dhan
 Fyers
 5paisa
 mStock
 Kotak Neo
 HDFC Sky
 Motilal Oswal
 IIFL Capital
 Alice Blue
 Flattrade
 Shoonya
 Firstock
 Rupeezy
 Pocketful
 Tradejini
 TradeSmart
 Zebu
 Compositedge
 Jainam
 Arrow
 Infinn
 ProStocks
 Anand Rathi
 Rmoney
 Indiabulls Securities
 Wisdom Capital
Broker names and logos belong to their respective owners; no affiliation or endorsement implied.
One plan. Everything included.
Every tool, every index, every alert. Nothing held back.
Ultimate
or ₹10,701 a year: 12 months for the price of 9.
About ₹57 a trading day, less than three ₹20 orders.
Every tool — the dealer positioning cockpit, trending OI, the option chain, volatility and expiry analytics, the screeners, alerts, briefs and replay. Cancel anytime.
Get UltimateFrequently asked questions
Everything you need to know before you start.
Disclaimer: OIData is an independent, third-party analytics tool. It is not a SEBI-registered investment adviser, research analyst, or stockbroker. The data, charts, indicators and AI-generated reads presented on this platform are for informational and educational purposes only and do not constitute buy, sell or hold recommendations for any security. Trading in derivatives involves substantial risk and is not suitable for all investors. Users should consult a qualified financial adviser before making any investment decisions. Past performance is not indicative of future results.
Ready to read the open interest?
Ultimate is ₹1189 a month, about ₹57 a trading day, every tool included. Cancel anytime.