Reading buildup on a single stock takes ten seconds: price up with open interest up is a long buildup, price down with OI up is a short buildup. Where that knowledge stops being academic is when you apply it to all two hundred–odd F&O names at once and ask a different question — where is money actually being committed today, and which way?
That is a ranking problem, not a reading problem, and it is what a buildup screener is for.
The four states, in one table
Buildup comes from reading futures price change and futures open interest change together. Neither means much alone.
| Price | Open interest | Label | What it says |
|---|---|---|---|
| Up | Up | Long Build Up | New longs entering; fresh money backing the move up |
| Down | Up | Short Build Up | New shorts entering; fresh money backing the move down |
| Down | Down | Long Unwinding | Existing longs exiting; the move down is closure, not conviction |
| Up | Down | Short Covering | Existing shorts exiting; the move up is closure, not conviction |
The important split is the top half against the bottom half. A long buildup and short covering both show a rising price, but one is new capital arriving and the other is old capital leaving. The first tends to continue; the second tends to run out of fuel once the shorts are done. The full logic behind each state is worked through in OI buildup explained.
Why screening changes what you see
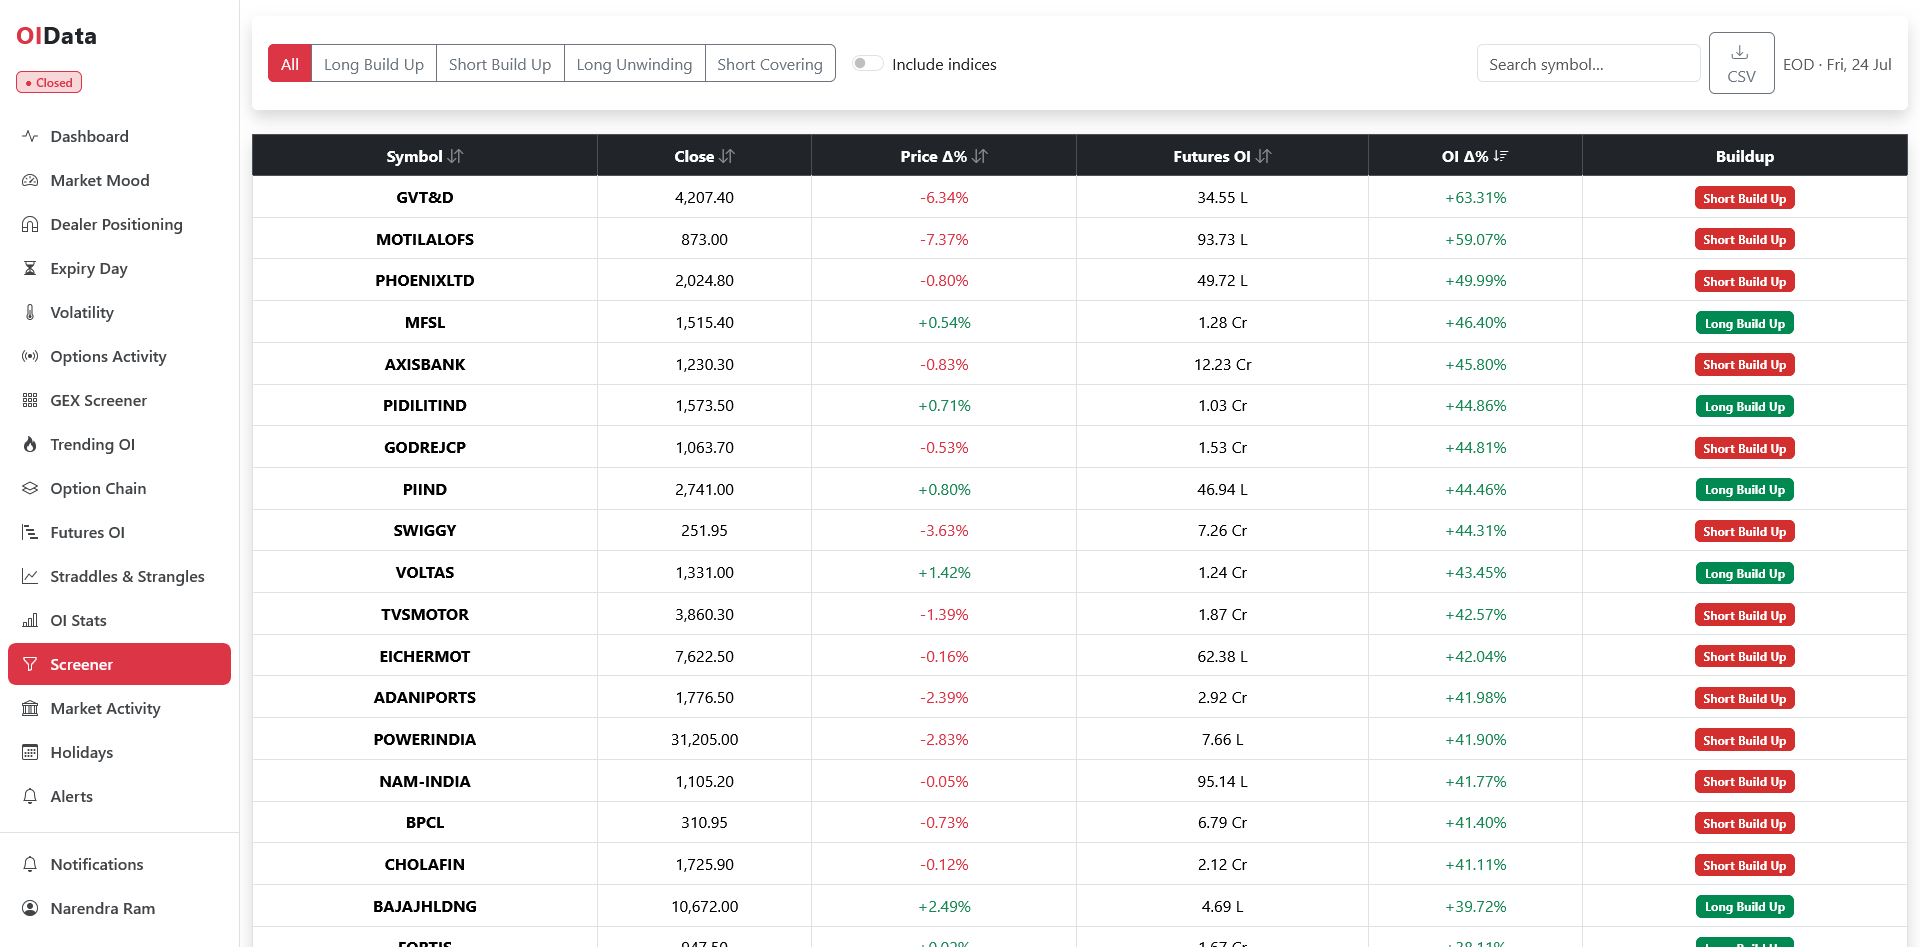
Look at the screenshot. Sorting the entire F&O universe by open-interest change surfaces GVT&D at +63.31% OI with price down 6.34% — a short buildup at a scale you would never find by browsing. MOTILALOFS sits just under it at +59.07% OI on a 7.37% fall. Meanwhile MFSL added 46.40% OI on a rising price, a long buildup, and AXISBANK — a far bigger, far more liquid name — added 45.80% OI while slipping 0.83%.
Three things fall out of that view that a single-stock read cannot give you:
Scale becomes comparable. Percentage change in OI normalises across a universe where futures OI ranges from a few lakh units to several crore. AXISBANK at 12.23 Cr units and GVT&D at 34.55 L units are wildly different books; the percentage puts them on one axis.
Agreement becomes visible. One stock building shorts is a stock story. Fifteen of the top twenty being short buildups — roughly what the screenshot shows — is a market story, and worth cross-checking against FII and DII activity to see who is behind it.
Disagreement becomes findable. A long buildup sitting inside a list dominated by short buildups is a name going against the tape on real new positioning. Those are frequently the most interesting rows on the screen.
Reading the screener without fooling yourself
Sort by magnitude, both ways. The OI and price columns sort by absolute size, so the biggest movers surface whether they are positive or negative. A −40% OI change is as informative as a +40% one; it is just a different state.
Filter to one state at a time. The buildup filters — Long Build Up, Short Build Up, Long Unwinding, Short Covering — turn the screener from a list into an answer. “Show me every short covering candidate” is a usable question.
Watch the OI base, not just the percentage. A stock going from 40,000 to 65,000 units prints a huge percentage on a book too small to matter. Read the Futures OI column alongside the OI Δ% column, always.
Remember it is futures only. This screen reads the futures book. A stock can look quiet in futures while its options chain is doing something significant, which is a different screen entirely.
Indices are hidden by default. The Include indices toggle adds NIFTY, BANKNIFTY and the rest into the same ranking. Useful for context, but they will dominate the OI columns in absolute terms, so mostly leave it off when hunting stocks.
Rollover week distorts everything. In the last few sessions before monthly expiry, OI falls in the front month and builds in the next one for reasons that have nothing to do with conviction. A long buildup flagged during rollover deserves a second look.
From a long buildup to an actual trade
The screener finds candidates; it does not size or time them. A workable sequence:
- Filter to the state you want — say, long buildup.
- Check the price move is real — a 0.2% price change with a 40% OI build is ambiguous positioning, not a directional bet.
- Confirm on the futures page. Futures OI shows the interval-by-interval buildup for that symbol, plus basis and annualised carry, so you can see whether the position built steadily or in one burst.
- Check the options side. If the name has a liquid chain, the option chain tells you whether writers are defending a level nearby.
- Note the expiry. The screener reads the front-month contract, listed per row.
Live during the session, frozen at the close
During market hours the screen refreshes every thirty seconds and the price column shows LTP. After the close it switches to the exchange’s end-of-day figures and is stamped with the session date — the version in the screenshot is EOD for Friday 24 July. Both are useful for different things: the live read for intraday positioning, the frozen read for a clean day-over-day comparison. Everything visible exports to CSV, and the official contract-level data behind it is published by NSE.
On OIData
The Screener page ranks the full F&O universe by buildup state with search, sorting, the indices toggle and CSV export. Once a name looks interesting, Futures OI breaks that single symbol down through the session, and Trending OI does the same for index option strikes.
Takeaways
- Long buildup is price up with OI up; short buildup is price down with OI up. Both mean new money.
- Unwinding and covering mean old money leaving, which is why those moves fade more often.
- Screening the whole universe reveals scale, agreement and disagreement that single-stock reads cannot.
- Always read OI change percentage against the OI base, and discount rollover week.
- The screener finds candidates. Confirmation comes from the futures and options detail.