The option chain is the single most information-dense screen in options trading. At first glance it’s a wall of numbers; once you know the layout, it becomes a map of where the market expects price to go and which levels it’s defending. This guide walks through how to read it, using NIFTY and BANK NIFTY as examples.
What an option chain is
An option chain lists every available option contract for an underlying and a chosen expiry, organised by strike price. For each strike it shows the call option and the put option, along with their prices and activity. Indian convention (the NSE option chain, and tools built on it) puts calls on the left, puts on the right, and the strike prices running down the middle.
The anatomy
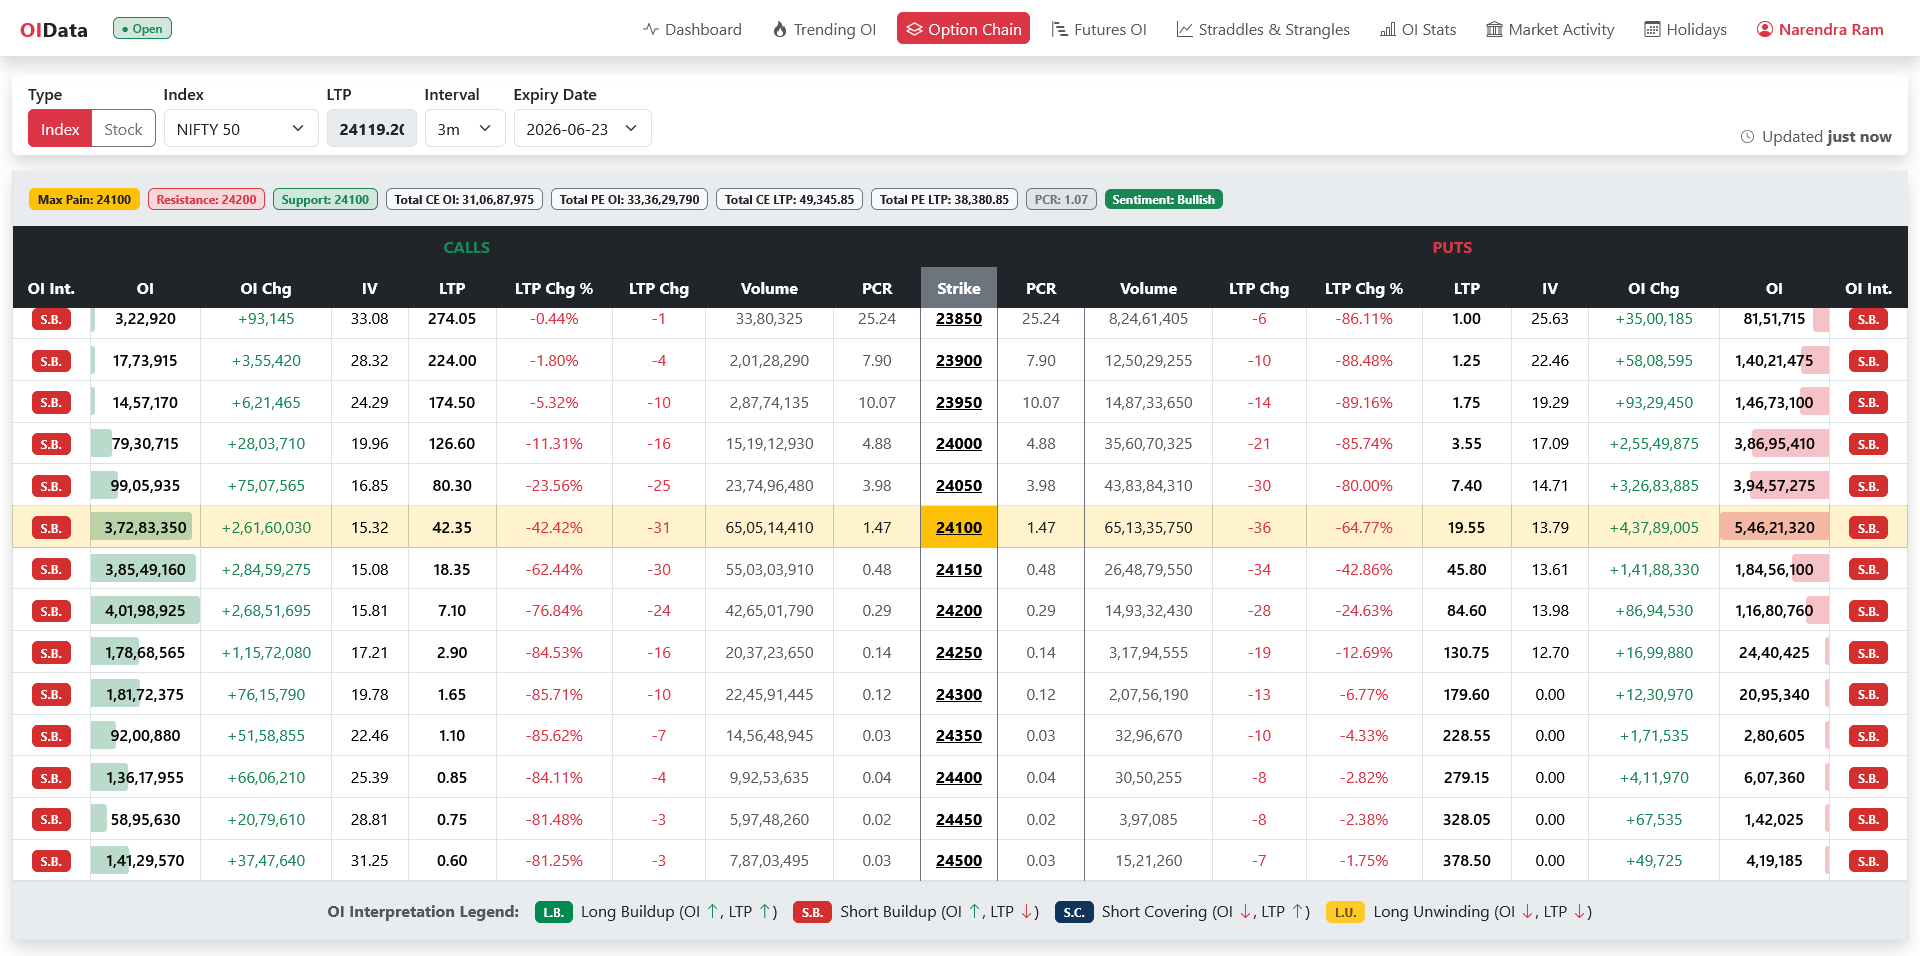
- The strike column is the spine. Strikes are listed at fixed intervals (for example, every 50 or 100 points on an index).
- To the left of each strike: that strike’s call data.
- To the right: that strike’s put data.
- The rows near the current spot price are the ones to focus on — that’s where almost all the liquidity and information lives.
The columns that matter
You don’t need every column. These are the ones that earn their place:
- LTP — last traded price of the option (its premium).
- OI (open interest) — how many contracts are open at that strike. Big OI = a level the market cares about. (New here? Start with What Is Open Interest?.)
- Change in OI — how much OI has moved today. This is where fresh positioning shows up, and it’s often more useful than the raw total.
- Volume — how active the strike is today; your liquidity check.
- IV (implied volatility) — the market’s expectation of future movement, baked into the premium. Higher IV = pricier options.
- Bid / Ask — the spread you’ll actually trade against; wide spreads warn of thin liquidity.
ATM, ITM and OTM
Three labels you’ll use constantly:
- ATM (at-the-money) — strike closest to the current spot price.
- ITM (in-the-money) — calls below spot / puts above spot; they have intrinsic value.
- OTM (out-of-the-money) — calls above spot / puts below spot; pure time + volatility value.
Most of the action — and most of the meaningful OI — clusters around ATM and the near OTM strikes.
Reading OI concentration: support and resistance
This is the option chain’s superpower. Large open interest at a strike marks a level the market is positioned around, and because much of that OI belongs to option writers (sellers), those levels often behave like support and resistance:
- Heavy call OI above the spot → potential resistance. Call writers there are betting price stays below; they defend that level.
- Heavy put OI below the spot → potential support. Put writers are betting price stays above.
A common shorthand: the strike with the highest call OI is the near-term ceiling the market is leaning on, and the strike with the highest put OI is the floor. When price approaches and these walls grow (rising change-in-OI), the level is being reinforced. When they shrink, the level is weakening and may give way.
Change in OI: where today’s positions are forming
The raw OI total can be weeks old. Change in OI tells you what’s happening now:
- Rising call OI at a strike → fresh call activity (often writing = resistance forming) at that level.
- Rising put OI at a strike → fresh put activity (often writing = support forming).
- Falling OI → that level is being unwound; the wall is coming down.
Always read change-in-OI together with the option’s price. Rising OI with a falling call premium points to call writing (bearish for that level); rising OI with a rising call premium points to call buying (bullish). That price-plus-OI logic is the same engine behind OI buildup signals.
PCR at a glance
Many traders glance at the Put-Call Ratio — total put OI divided by total call OI — as a one-number summary of positioning. It’s useful but easy to misread (it’s often a contrarian gauge, and absolute thresholds are a trap). We cover it properly in Put-Call Ratio (PCR) Explained.
A practical daily routine
The exchange publishes the underlying chain itself at NSE India, which is worth a look once so you know what the raw data looks like before a tool reformats it.
- Pick the right expiry. For a short-term view use the nearest weekly; for positional, the monthly.
- Find the ATM strike and look a few strikes either side — ignore the far wings.
- Mark the highest call OI (resistance) and highest put OI (support).
- Scan change-in-OI to see which walls are being built or torn down today.
- Sanity-check liquidity with volume and the bid-ask spread before you trade a strike.
- Confirm with price. The chain tells you where levels are; price action tells you whether they’re holding.
NIFTY vs BANK NIFTY notes
Both read the same way, but BANK NIFTY tends to be more volatile — wider strike intervals matter, levels break more often, and premiums move faster. NIFTY is generally steadier, so OI walls tend to hold a little better. Treat BANK NIFTY signals with a bit more caution and always check current contract specifications and expiry dates on NSE, since exchanges revise them periodically.
On OIData
The Option Chain page gives you OI, change-in-OI, volume and IV per strike in a clean layout, and Trending OI surfaces where positioning is shifting fastest so you don’t have to scan manually.
Related reading
Volume bursts on the same chain arrive minutes before the OI does — see unusual options activity — and the gamma-weighted read of the same strikes is in gamma exposure explained.
Takeaways
- Calls left, puts right, strikes down the middle — focus on rows near spot.
- The columns that matter: OI, change-in-OI, volume, IV, LTP.
- Highest call OI = resistance; highest put OI = support — and watch change-in-OI to see those walls build or break.
- The chain shows you levels; always confirm with price before acting.