If you trade NIFTY or BANK NIFTY options — or even just watch the market — you have seen the phrase “open interest” everywhere. Most explanations make it sound complicated. It isn’t. OI is simply a count of how many derivative contracts are still open (not yet closed or settled) at a given moment. Learning to read it well is one of the highest-leverage skills in F&O trading, because it tells you something price alone can’t: how much money is actually committed to the market.
Open interest, defined
Open interest (OI) is the total number of outstanding futures or options contracts that have not been squared off, exercised, or expired. Every derivative contract has two sides — a buyer and a seller — but OI counts the contract, not the two sides. So one open contract adds exactly 1 to the total OI, no matter how many times it later changes hands.
That single idea explains almost everything about how OI behaves.
A simple example: building the number trade by trade
Imagine a brand-new options series where OI starts at zero. Watch what happens with each trade:
| Step | What happens | OI | Why |
|---|---|---|---|
| 1 | Trader A buys 1 contract; Trader B sells 1 (both opening new positions) | 1 | A new contract is created |
| 2 | Trader C buys 1; Trader D sells 1 (both new) | 2 | Another new contract created |
| 3 | Trader A sells her contract to Trader E (A closes; E opens) | 2 | Position changed hands — no new contract |
| 4 | Trader C sells to Trader D, who was short (both closing) | 1 | A contract is removed from the market |
Notice the three distinct cases:
- New buyer + new seller → OI rises.
- One side transfers to a new participant → OI is unchanged.
- Existing long and existing short close against each other → OI falls.
That’s the whole mechanic. OI rises when fresh positions are created and falls when existing positions are closed.
Open interest is about positions, not activity
This is the part beginners most often get wrong. OI is not how many contracts traded today — that’s volume. It is how many contracts are still open right now. (If you’re unsure of the difference, read Open Interest vs Volume next — it’s the single most useful distinction in this whole topic.)
Think of it like a parking lot. Volume is how many cars drove in and out through the day. OI is how many cars are parked in the lot at the moment you look. A busy day (high volume) can still end with an empty lot (low OI) if everyone went home.
Why open interest matters
On its own, this metric is just a number. Paired with price, it becomes a window into conviction and positioning:
- Participation and liquidity. Strikes and contracts with high OI are where the crowd is. They tend to be more liquid (tighter spreads, easier fills) and more meaningful to watch.
- Conviction behind a move. A price move on rising OI means new money is backing it — more durable. A move on falling OI often means traders are simply closing out — less durable. The four combinations of price and OI form the classic “buildup” signals: long buildup, short buildup, short covering and long unwinding. We break those down in OI Buildup Explained.
- Support and resistance. In options, large open interest at a strike marks a level the market cares about — often where option writers are defending. Heavy call OI above the spot tends to act as resistance; heavy put OI below tends to act as support. Reading the option chain shows you exactly where to look.
How OI changes through the day
During market hours the exchange disseminates OI, and you’ll see it move as positions are opened and closed. The figure you should treat as authoritative is the end-of-day OI published after the session — intraday numbers are useful for spotting where fresh positions are forming, but the EOD figure is the clean record.
A practical habit: watch change in OI (today’s OI minus the previous close) rather than the raw total. The change is where the new information is — it tells you where positions are being added today, which is far more actionable than a large but stale total built up over weeks.
Open interest and expiry
Index and stock derivatives expire on a fixed schedule (NIFTY, for example, has weekly as well as monthly expiries — always check NSE India for the current expiry calendar, as exchanges revise it from time to time). As a series approaches expiry, its OI collapses toward zero: open positions are either squared off or settled. At the same time, traders “roll over” to the next series, so you’ll see OI drain from the near contract and build in the next one. Watching rollover activity around expiry is a useful gauge of whether the crowd is carrying its view forward or stepping aside.
Where to see OI on OIData
OIData is built around exactly these readings:
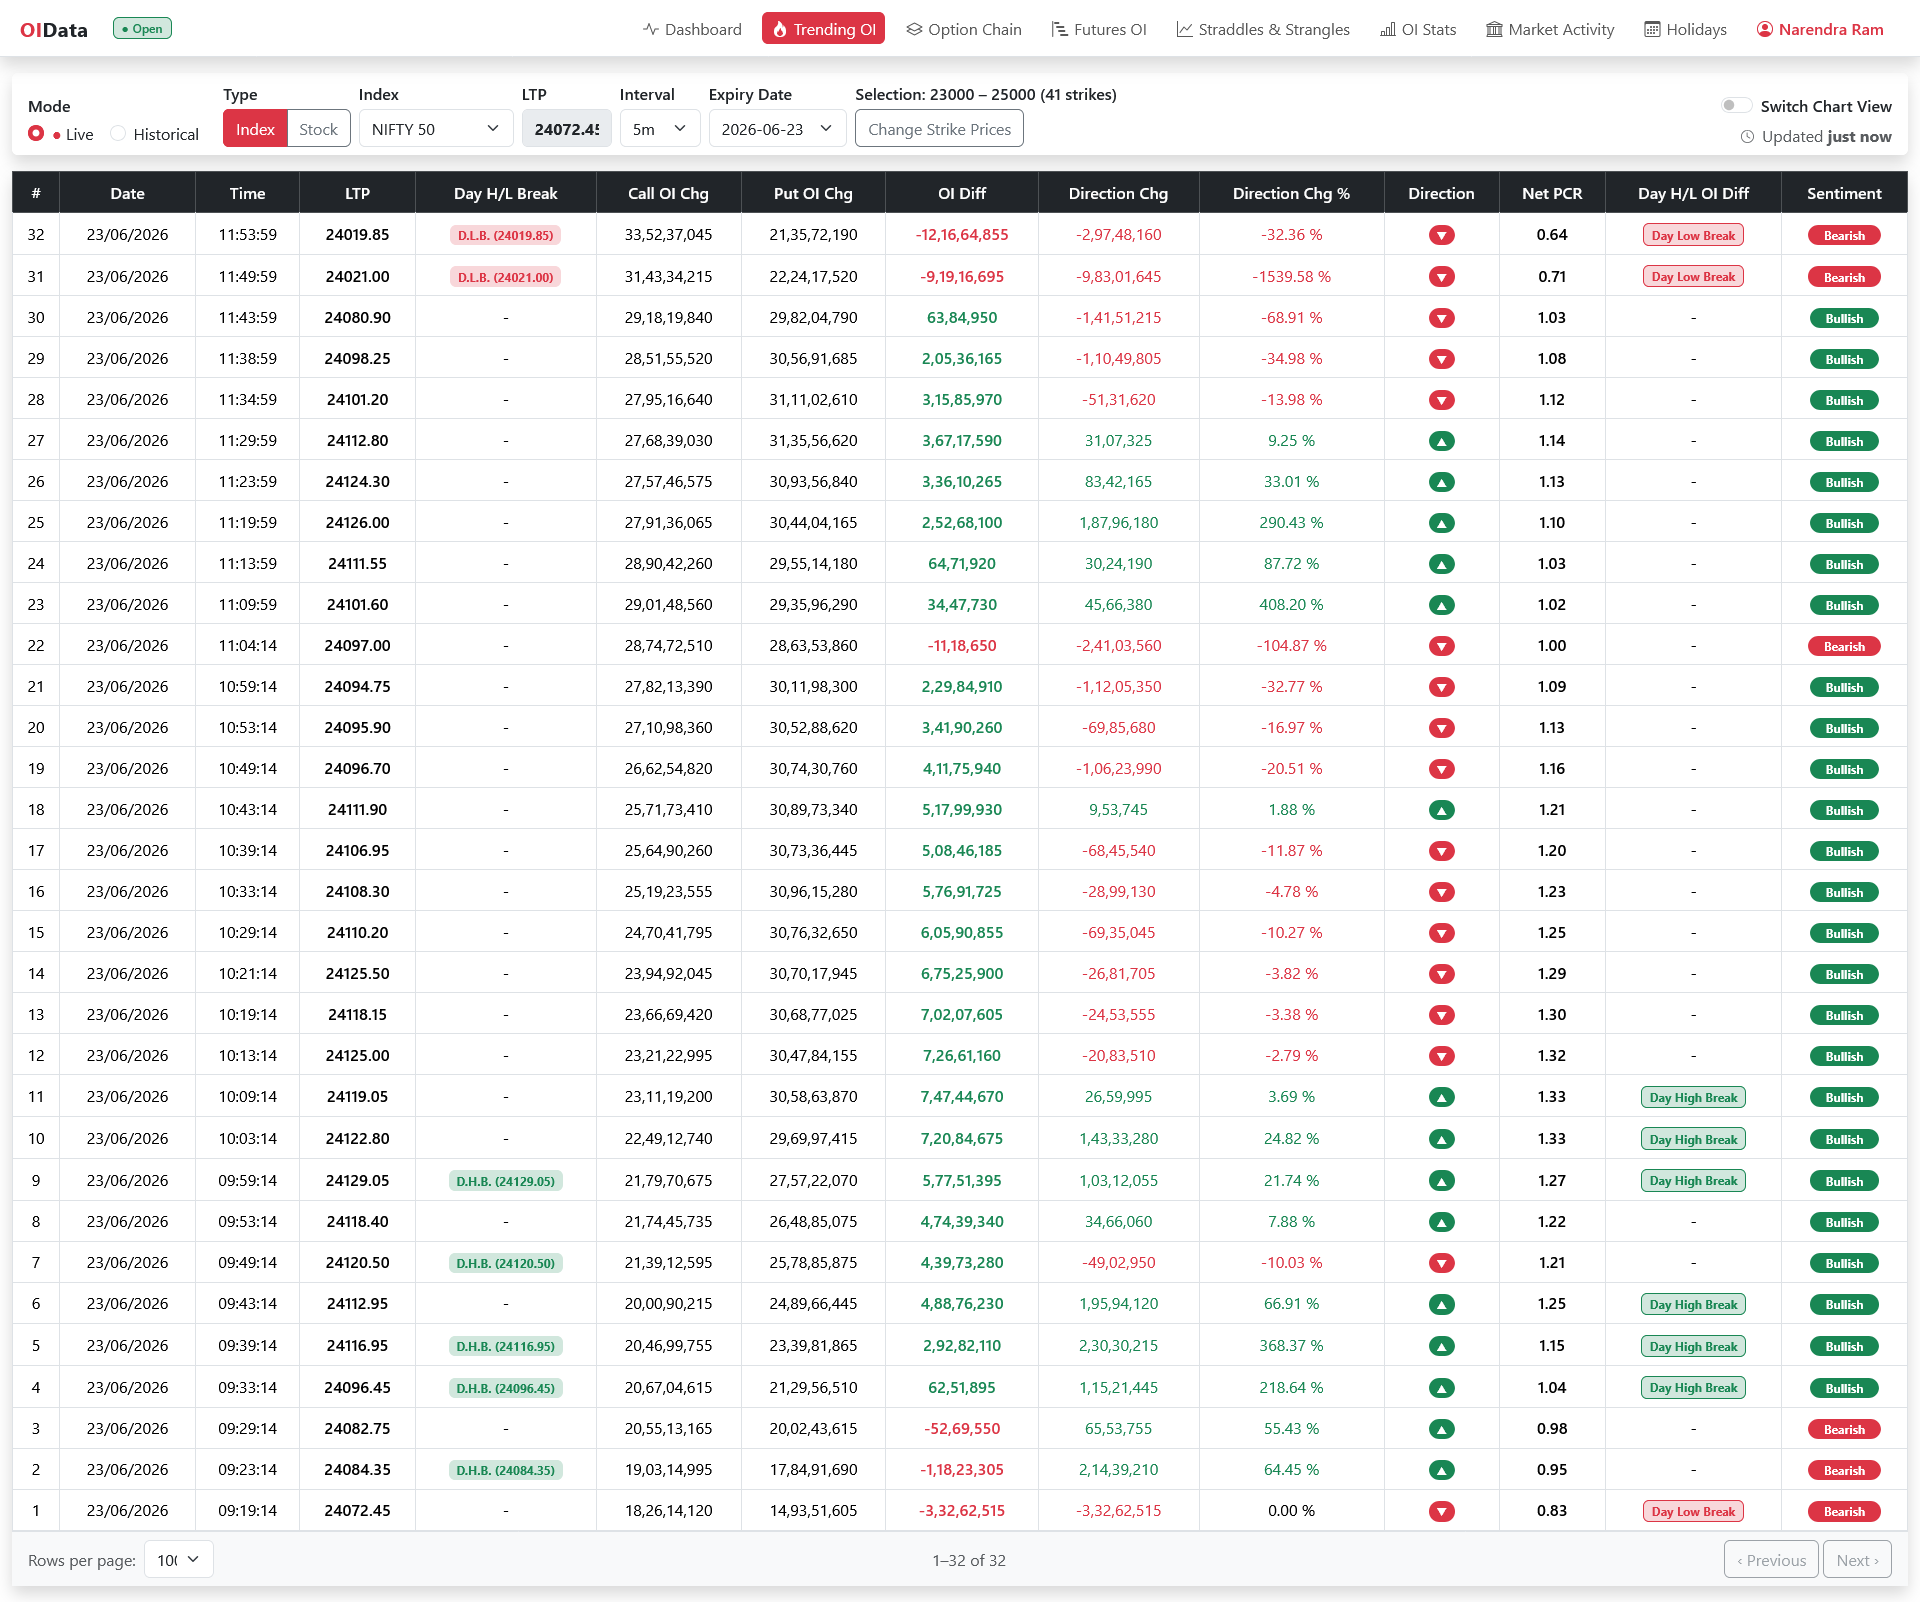
- Trending OI — where OI is building and unwinding across strikes and instruments.
- Option Chain — OI and change-in-OI per strike, the map of support and resistance.
- OI Stats and the Dashboard — aggregate positioning at a glance.
- Futures OI — OI in the futures, where the four buildup signals read most cleanly.
Related reading
Once the total makes sense, the faster read is volume — see unusual options activity — and the hedging map built on top of OI is in gamma exposure explained.
Key takeaways
- Open interest is the number of derivative contracts still open — counted once per contract, not per side.
- It rises when new positions are created and falls when positions are closed; it’s unchanged when a position merely changes hands.
- It measures commitment, not activity — that’s volume’s job.
- Its real power shows up when you read it alongside price, which is where buildup signals, support/resistance and rollover analysis come from.
Start by simply watching change in OI next to price each day. Once that clicks, the rest of open interest analysis follows naturally.