American traders talk about “options flow” because they can see it: a consolidated trade tape marks every fill as buy or sell, at the bid or the ask. India has no such tape. NSE publishes volume and open interest, not signed trades — so anyone selling you “institutional buy flow” on Indian options is inferring it, whether they admit it or not.
What you can do honestly is measure unusual options activity: find the strikes where volume has suddenly jumped far above its own normal rate, and then work out whether that volume is opening new positions or just recycling old ones. That is a real, checkable signal, and it arrives faster than any open-interest read.
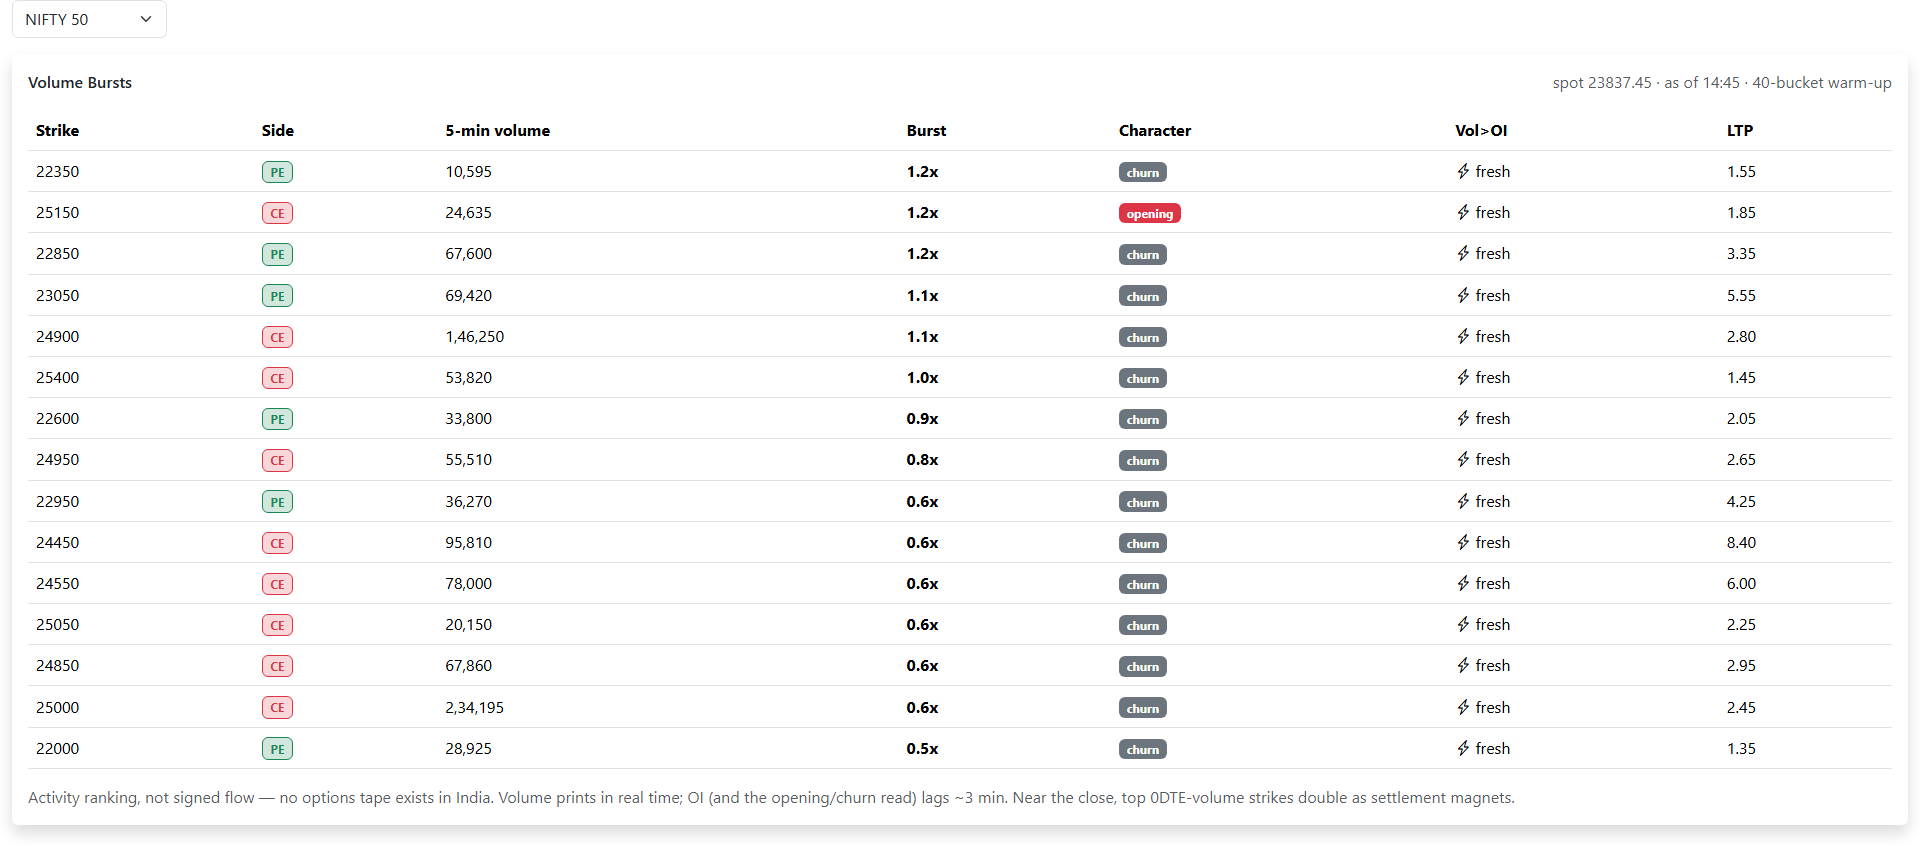
What counts as unusual options activity
The trick is the baseline. A NIFTY at-the-money strike trading a million units in five minutes is a quiet afternoon; a far out-of-the-money strike doing a tenth of that is extraordinary. Comparing strikes against each other tells you nothing, so each strike is compared against itself.
OIData persists per-strike cumulative volume every minute and diffs it into five-minute buckets. Because NSE volume is cumulative, that subtraction is exact — there is no sampling error. For each strike and side it then takes the median of that session’s earlier buckets as the run-rate, and divides the latest bucket by it.
The result is the burst multiple. A strike showing 8.0x traded eight times its own typical five-minute volume in the last bucket. Anything at 5x or above is highlighted, and the feed is ranked by that multiple, top fifteen.
Two deliberate filters keep the list honest:
- A bucket needs at least 10,000 units of volume to qualify at all, which floors out far-OTM strikes where three lots against a median of zero looks like infinity.
- A strike needs at least six prior buckets to have a median worth trusting, which is why the feed warms up half an hour or so after the open rather than at 9:16.
Why volume beats open interest for this
Open interest is the better measure of commitment, but it is slow. Exchange OI updates lag roughly three minutes behind the tape, and it only ever shows you a net figure — a strike where one player opened 10,000 lots and another closed 10,000 shows zero change.
Volume has neither problem. It prints in real time and it counts every contract that traded. So unusual options activity leads the OI-based reads: the burst shows up first, and the OI buildup confirms or denies it a few minutes later.
That ordering is the practical value. It buys you a few minutes of warning, not a prediction.
Opening flow versus churn
Unusual options activity is only half a signal until you answer this next question. A volume burst on its own is ambiguous. Ten thousand contracts could be a fund establishing a position, or the same 500 contracts being passed between scalpers twenty times. Those mean opposite things, and telling them apart is the second half of the job.
The test is the strike’s change in open interest over the same bucket, measured against that bucket’s volume:
- If OI grew by more than a quarter of the volume that traded, the flow is tagged opening — contracts that existed at the end of the bucket did not exist at the start, so somebody committed.
- Otherwise it is tagged churn — heavy trading that left the position count roughly where it started. Intraday hands passing paper around.
Matching the timescales matters more than it sounds. Using session-cumulative OI change against a five-minute volume print systematically mislabels afternoon churn at any strike that had a morning build, because the morning’s OI growth keeps counting forever. Bucket against bucket is the only read that stays honest after lunch.
There is a third column worth watching: Vol > OI, flagged as fresh. When a strike’s cumulative session volume exceeds its total open interest, essentially the whole position at that strike turned over today. That is a strike the market only started caring about this morning — which is a different, and often more interesting, thing than a strike that has been heavily owned for a week. The distinction between the two measures is covered in open interest vs volume.
How to use unusual options activity in practice
Read it as attention, not direction. A burst at the 24000 call tells you that strike suddenly matters. It does not tell you whether the volume was buyers or sellers — and it genuinely cannot, because NSE does not publish that. A burst at a call strike is just as consistent with aggressive writing as with aggressive buying.
Get direction from somewhere else. Pair the burst with the price action at that strike and with the OI change: volume bursting while OI builds and premium rises points at buyers; volume bursting while OI builds and premium falls points at writers. The option chain gives you both halves.
Watch where bursts cluster. One strike lighting up is noise. Three adjacent strikes on the same side lighting up in the same bucket, tagged opening, is a position being built across a range — and it often lands just before a level breaks.
Respect the warm-up. The first half hour has no reliable median, so the feed stays empty. That is the model refusing to guess, not a fault.
Do not chase 5x on a quiet strike. The multiple is relative. A strike whose median is tiny can print a huge multiple on volume that is meaningless in rupee terms. Check the raw interval volume alongside the multiple.
What this is not
It is not signed flow. It is not “smart money buying calls”. It is not a leading indicator of direction, and any tool that claims to give you signed institutional flow on Indian options is reconstructing it from the same public volume and OI data everyone else has.
What unusual options activity does give you is a genuine, fast answer to a narrower question: where did attention just arrive, and did anyone commit capital when it did? Used that way it is one of the more reliable reads on the screen. Used as a direction signal it will hurt you.
On OIData
The Options Activity page runs this feed live for NIFTY, BANKNIFTY and SENSEX, refreshing every minute — burst multiple, interval volume, the opening-versus-churn tag, the Vol > OI flag and the last traded price per strike. For the slower, committed version of the same picture, Trending OI and the Option Chain show where the open interest actually settled.
Takeaways
- Unusual options activity measures each strike’s five-minute volume against its own session median, not against other strikes.
- The burst multiple ranks the feed; 5x and above is where it gets interesting.
- Volume leads OI by a few minutes and counts every contract, which is why bursts arrive before buildup reads do.
- Opening means the bucket’s OI grew alongside its volume; churn means it didn’t.
- It tells you where attention arrived — never which side traded.