The option chain is a photograph. It shows every strike at one moment: how much open interest sits at each, what the premium is now, how much changed today. It is the most useful single screen an options trader has, and it is also silent about the one thing that decides whether a level will hold: how it got there. Strike history is the film that photograph was cut from. It follows one strike, the call and the put, session by session, from the day the contract was listed until the day it expires. Read a few of these and the chain stops being a list of numbers and starts being a set of stories, each with a beginning you can check.
What strike history shows
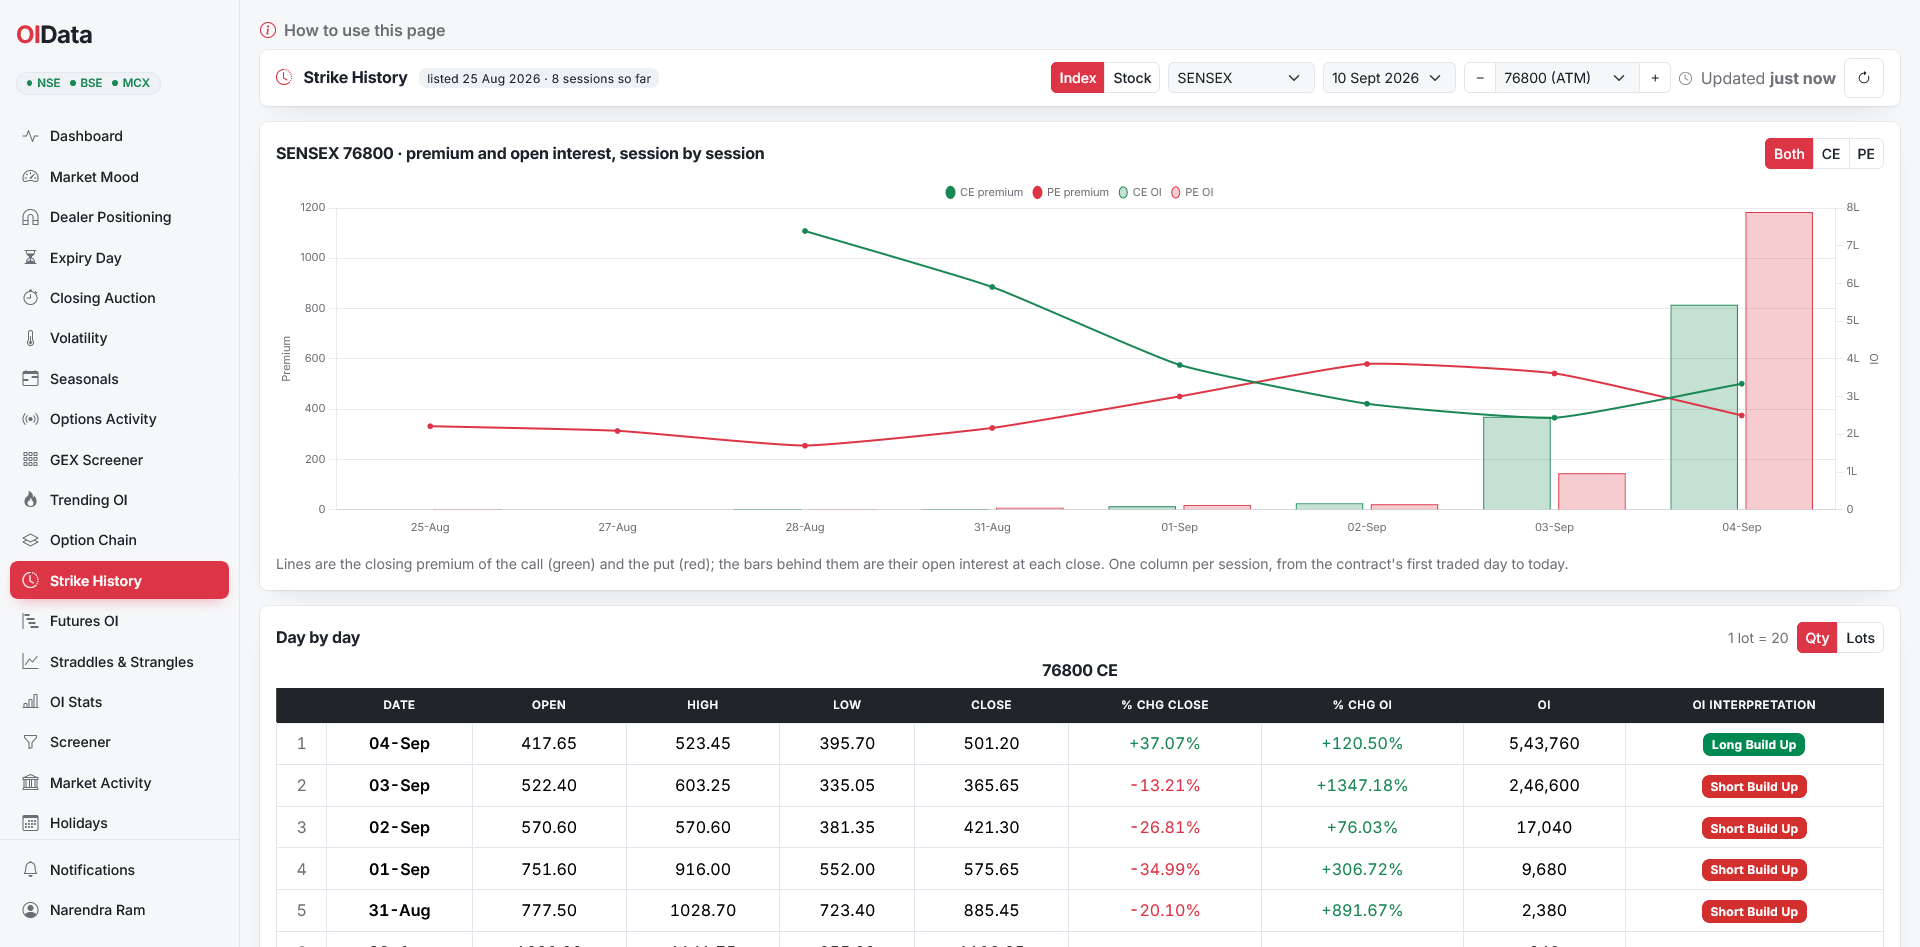
Every option contract has a life. A weekly NIFTY contract is listed a few weeks before it expires; a monthly contract is listed about three months out; a stock option runs on the monthly cycle. From its first traded session the contract prints a daily record, and strike history is simply that record laid out in order: the premium’s open, high, low and close, the open interest at each close, the percentage change in both from the previous session, and a one-word reading of what the two changes meant together.
Those columns answer different questions. The close tells you what the market paid for that strike each evening. The open interest tells you how many contracts were still held. The two percentage changes tell you which way each moved, and the reading at the end of the row turns that pair of directions into plain language. A row that says the close fell 4% while open interest rose 12% is a day when writers pressed harder; the label for it is Short Build Up. The same premium fall with open interest shrinking is buyers giving up, which is Long Unwinding. If you have read how open interest builds up and unwinds, you already know the four labels. Strike history is where you see them in sequence.
Why one strike’s story matters
Two strikes can carry identical open interest today and mean opposite things. One accumulated it over eight sessions, a little each day, with the premium drifting lower the whole way: writers built it, defended it, and are still collecting. The other jumped from nothing to the same number in a single afternoon, usually because a large position was rolled or a hedge was placed. The first is a wall that people are committed to. The second is a number that could leave the way it came.
The chain cannot tell these apart, because it only knows the total and today’s change. The support and resistance that open interest implies is only as reliable as the way the position was built, and that is a question about days, not about now. Looking at the strike day by day is the only way to answer it.
The premium line adds a second check. A strike whose open interest keeps rising while its premium keeps falling is being sold into; a strike whose open interest rises with the premium is being bought. The bars tell you how big the position is, the line tells you who is winning, and the sequence of labels tells you whether that has been changing.
The four labels, read over days
A single Short Build Up day is noise; five in a row is a campaign. This is the main habit to build when reading a strike’s history: look for runs, not single rows.
- A run of Short Build Up on a call above spot is a resistance wall being constructed. The longer the run, the more the writers have at stake in defending it.
- A run of Long Build Up on a put below spot is buyers paying for protection, day after day. Premium rising with open interest is someone willing to pay up.
- Short Covering after a run of Short Build Up is the writers stepping back. Open interest falls, the premium rises, and the wall is being dismantled from the inside.
- Long Unwinding into the final sessions is the usual shape of a strike that finished out of the money: buyers accept the loss and the premium goes to nothing.
Days with no label are days where either the premium or the open interest did not change. Near expiry that happens more often than you would expect; the contract is simply going quiet.
A worked reading
Spot is near 25,000 and the 25,100 call is the heaviest strike on the chain. Its history shows the open interest bars growing for six straight sessions while the closing premium drifts from 140 to 95: six Short Build Up rows. That wall was built deliberately, by writers who kept adding as the market failed to get through, and it will take real buying to dislodge it. Now the last two rows show the bars shrinking with the premium rising, both labelled Short Covering. The writers are stepping back. The chain, read alone, would still show the biggest wall on the board; the history says it is already being taken down.
Reading calls and puts together
A strike is two contracts, and the second one often explains the first. When the 25,100 call is being written, look at the 25,100 put. If its open interest is also rising with a falling premium, the strike is being sold from both sides, which is the signature of a straddle or strangle writer betting the market stays put. If the put is being bought while the call is being written, the market has a direction in mind. That is why a strike’s history is best read with the call and the put side by side rather than as two separate screens.
What to check before expiry week
Contract lifetimes are shorter than they used to be. Since November 2024 each exchange lists weekly expiries on only one benchmark index, a change set out in the regulator’s equity derivatives framework, so a weekly strike’s whole story fits in a few weeks and the last three or four sessions carry most of the decision. Before expiry week, read the heaviest call and put on the chain from listing to today and ask two questions: was the position built over days or in one go, and is the latest run still adding or already unwinding? That pairs naturally with the expiry-day reading of open interest, which starts where the history ends.
On OIData
The Strike History page does exactly this for any strike. Pick an index or an F&O stock, an expiry and a strike, and you get the call and the put from the contract’s first traded session to today: the premium drawn over the open interest on one chart, and the full ledger with the daily changes and the build-up reading underneath. Open interest can be shown in quantity or in lots, and today’s row updates through the session. Expired contracts stay available for at least six months, so a finished strike can be read from listing to its last session.
You do not have to leave the option chain to start. Clicking any strike in the chain opens a quick look at its latest sessions, and one button opens the full page on the same contract.
Strike history FAQ
What is strike history? The day-by-day record of one option strike: the call and the put’s opening, high, low and closing premium, their open interest at each close, the change in both from the previous session, and the build-up reading those changes imply.
How far back does it go? To the contract’s first traded session. Weekly index contracts are listed a few weeks before expiry and monthly contracts about three months before, so the history is as long as the contract’s life.
How is it different from the option chain? The chain shows every strike at one moment. Strike history shows one strike across every session it has traded. Use the chain to find the strikes that matter and the history to see how they got there.
Does it work for stock options? Yes. Any stock in the F&O list works the same way, with its own expiries and strikes.
Takeaways
- The chain shows where the walls are; strike history shows how they were built.
- Read runs of labels, not single days. Six Short Build Up rows are a campaign; one is noise.
- Premium direction against open interest direction tells you who is winning at that strike.
- Read the call and the put together; the second contract usually explains the first.
- Before expiry week, check whether the heaviest strikes are still being added to or already unwinding.