Open interest is a total. It tells you how many contracts are alive at a strike, and it is the number every option chain shows first. But a total cannot tell you what traders are doing right now, because it carries everything that happened since the contract was listed. For that you need the change in OI: how much open interest was added or removed in a given slice of time, on the call side and on the put side, strike by strike. This guide explains how to read the change in OI through a session, why the sequence of intervals matters more than the daily figure, and how the same numbers turn into a bullish or bearish lean.
What the change in OI actually measures
Every option contract has a buyer and a writer, and open interest counts the contracts that are open between them. When a new buyer meets a new writer, open interest rises by one. When an existing holder closes against an existing writer, it falls by one. The change in OI over an interval is simply the open interest at the end of the interval minus the open interest at the start, so a positive number means new positions were opened on balance and a negative number means positions were closed.
Two things about that definition matter in practice. First, the change is measured per strike and per side, so a call at 24,500 and a put at 24,000 each have their own figure. Second, the interval is a choice. The NSE option chain shows the change since the previous close; a table of intervals shows the change in each 5, 15 or 30-minute slice, which is a different and usually more useful view.
Why intervals beat the daily total
A daily figure nets everything together. If writers sold two lakh contracts of a call in the morning and bought them back after lunch, the day’s change in OI at that strike is close to zero, and the chain shows nothing happened. The intervals show the whole story: a build, then an unwind. Most of the information in open interest is in that sequence, and it is invisible in a single closing number. If you have read about the ten common mistakes in reading open interest, this is the one that costs most: treating the total as if it were the flow.
Calls, puts and the sign of the change
In index options most of the open interest is written, not bought, which is why a rising open interest number is usually read as writers pressing a view. Call OI added above spot is writers betting the index will not get through that level, and the level starts to behave as resistance. Put OI added below spot is writers betting the index will not fall through, and that level starts to behave as support. The support and resistance that open interest implies is built from exactly these changes.
So the sign of the change on each side carries a lean. Calls being added while puts are being removed is a bearish lean, because the market is being sold from above and the floor is being withdrawn. Puts being added while calls are being removed is the bullish mirror. When both sides are being added, the market is being boxed in, and when both are being removed, positions are being dismantled and the usual reading stops applying.
Diff in OI: the two sides in one number
Reading two columns and working out the lean every interval is slow, so the two are netted. Diff in OI is the put-side change minus the call-side change for the interval. A positive figure means puts were added faster than calls, which is the supportive side of the ledger; a negative figure means calls were added faster, the resisting side. One number per row is enough to see which way the interval leaned, and the columns beside it show how large each side was.
Direction of change: is the build accelerating?
The size of a change is one thing; whether it is growing or fading is another. A large build that is slowing down matters less than a smaller one that is speeding up, because the second is still being pressed while the first is already tiring. That is what the direction of change column tracks: it compares this interval’s change in OI with the previous interval’s, and marks whether the positioning is accelerating or losing pace. Runs of the same direction are what to look for. One interval is noise. Four in a row is a campaign.
Day Strength and Flow: two reads of the same tape
A session’s net tilt should be judged against the size of the option book, because ten lakh contracts of change means something different on a small weekly expiry than on a heavy monthly one. Day Strength sizes the day’s net change in OI against the book, and adds dots for how one-sided the repositioning has been. Flow scores only the last few intervals, so a strong morning build cannot keep the whole day looking like live pressure once it has stopped. When the two disagree, the day capsule tells you what has been built and the flow capsule tells you what is being built now.
Two chips sit beside the sentiment pill for the cases where the classic read does not apply. Unwind marks stretches where both sides are being dismantled rather than built. CAS tail marks the closing session after 15:15, when the auction print reshapes the day’s numbers; the closing auction guide explains why that stretch reads differently.
Net PCR and level breaks
Two smaller columns finish the row. The put-call ratio is recomputed per interval, so you see it move rather than reading one closing figure, which is the reading discussed in the PCR guide. And a Level Break tag appears beside the last traded price whenever the index broke the day’s high or low during that interval. A break that lands on the same row as a strong change in OI is a level that broke on fresh positioning; a break on a quiet row is a drift, and drifts are more often given back.
A worked reading
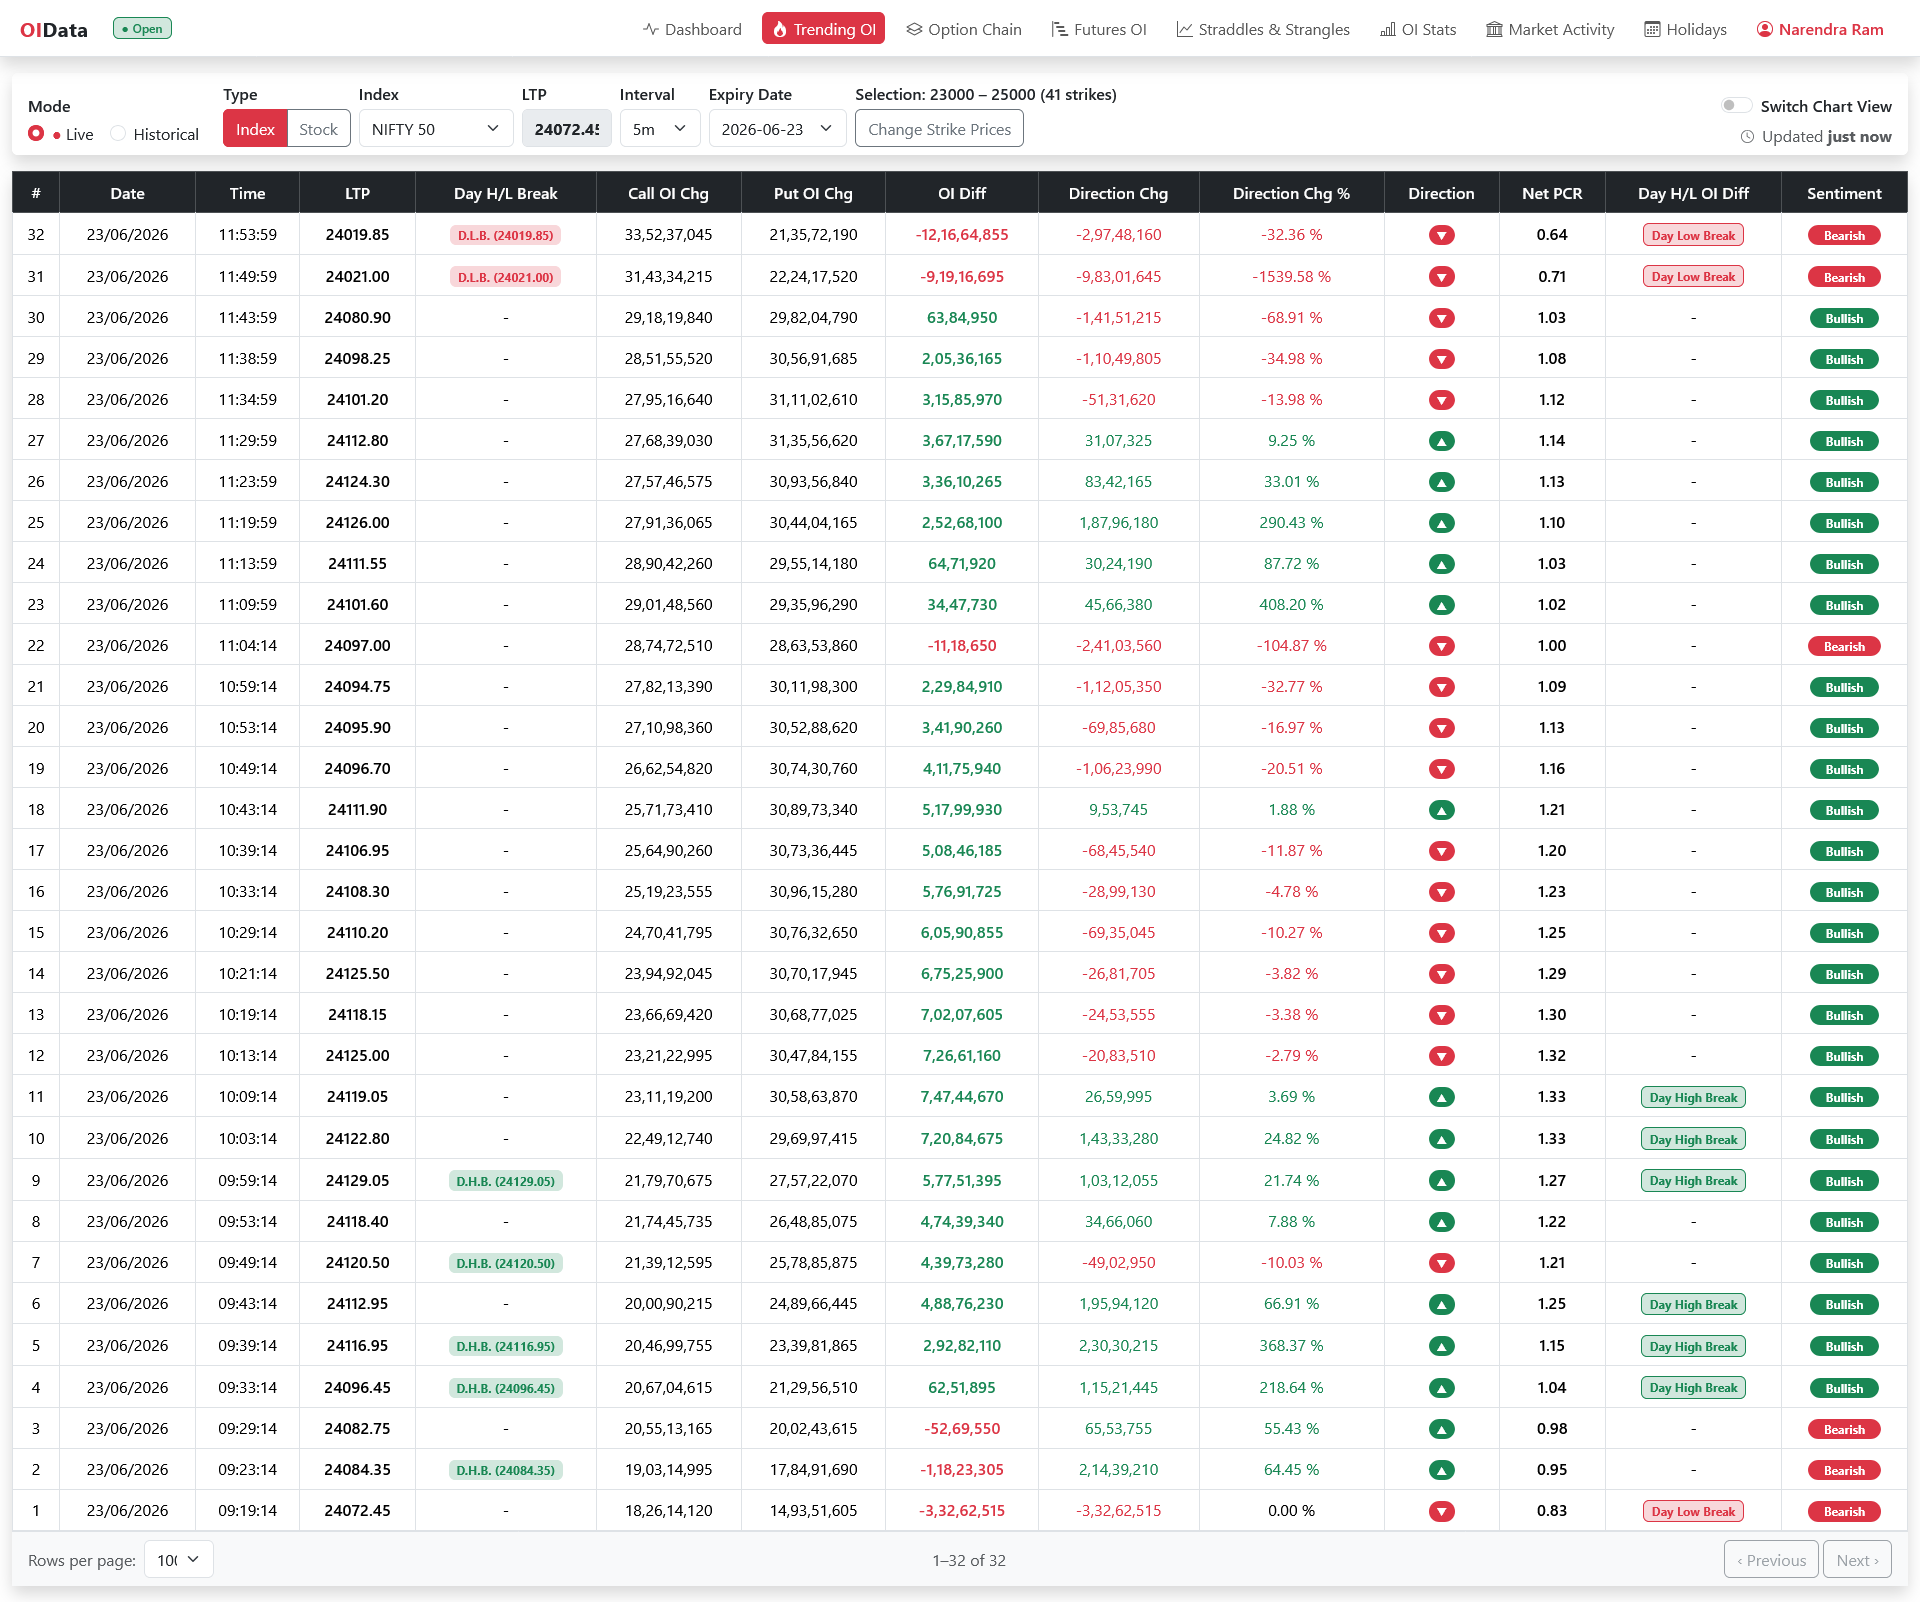
Take the session in the figure. Through the late morning the rows are bearish: call open interest is being added faster than put open interest, Diff in OI is negative, and the Day Strength capsule reads minus 17 to minus 19 percent with dots, a one-sided stretch. Around noon the tape turns. Puts start being added faster, Diff in OI flips positive, the Flow capsule reaches 99 and 100 percent with three dots, and the index breaks its day high on rows 13 and 14 while that build is running. Those are level breaks on fresh positioning. From about 14:45 the rows carry the Unwind chip: both sides are shrinking, and the last two rows carry CAS tail as the closing session prints. A single end-of-day figure would net the morning’s call build against the midday put build and show little of either. Read as intervals, it is a bearish morning, a bullish midday with confirmed breaks, and an afternoon of positions being taken off.
Where to read the change in OI
The Trending OI page is built around this table. Pick an index or an F&O stock, an expiry and an interval, and each row is one slice of the session with the change in call and put OI, Diff in OI, direction of change, Day Strength, Flow, the interval’s PCR and the sentiment read, with the D.H.B. and D.L.B. tags on the price. Live mode updates through the session through your own broker connection; Historical mode replays any recorded session so you can study a past expiry interval by interval. Open interest can be shown in contracts or in lots, and the strike range is yours to set.
Change in OI FAQ
What does change in OI mean? The open interest at the end of a period minus the open interest at the start, for one strike and one side. Positive means contracts were opened on balance; negative means they were closed.
Is a rise in call OI bullish or bearish? Above spot it usually reads bearish, because most index calls are written and the writers are betting the level holds. The change on the put side and the direction of price in the same interval decide how much weight to give it.
What is Diff in OI? The put-side change minus the call-side change for the interval, so a single number shows which side attracted more fresh positioning.
Why do the intervals matter more than the daily figure? Because the daily figure nets a build against an unwind. The sequence of intervals is where the information is.
Takeaways
- Open interest is a total; the change in OI is the flow, and the flow is what tells you what traders are doing now.
- Read intervals, not the day. A build and an unwind cancel in the daily number and stand out in the rows.
- Calls added above spot resist, puts added below support; Diff in OI puts the two on one line.
- Watch direction and runs. A smaller build that is accelerating beats a larger one that is fading.
- Level breaks that land on strong rows are the ones to respect.