The put-call ratio (PCR) is one of the most popular sentiment gauges in options trading — and one of the most misunderstood. Used well, the put-call ratio offers a quick, real-time read on how the crowd is positioned in the F&O segment. However, if you use it naively (such as believing a “put-call ratio above 1 means sell”), it will inevitably mislead you. In the fast-paced Indian derivative markets, understanding this metric can help you identify potential market reversals and overextended trends. This comprehensive guide explains what the put-call ratio actually measures, how to calculate it, and how to read it sensibly without falling into common retail trading traps.
What the put-call ratio is
The put-call ratio compares how much put activity there is relative to call activity. There are two common versions:
- Put Call Ratio (OI) = total open interest in puts ÷ total open interest in calls. The more widely watched of the two; it reflects standing positioning.
- Put Call Ratio (Volume) = total volume in puts ÷ total volume in calls. More reactive; it reflects today’s flow.
Unless stated otherwise, “PCR” usually means the OI-based version.
The formula
PCR (OI) = Total Put Open Interest / Total Call Open Interest
Worked example: if all NIFTY puts together have 80 lakh contracts of open interest and all calls have 1 crore, then the put-call ratio = 80,00,000 / 1,00,00,000 = 0.80.
You can compute this ratio for a whole index, for a single expiry, or even around a band of strikes near the spot.
How to interpret it — and why it’s contrarian
Here’s the counterintuitive part. A naive reading says “lots of puts = bearish.” But much of that put open interest is created by writers (sellers) who profit if the market stays up or flat. So heavy put positioning often reflects traders who are comfortable that support will hold — not panic.
That’s why the put-call ratio is frequently read as a contrarian indicator:
- Very high PCR (lots of puts relative to calls) → the crowd is heavily hedged/short via puts. Sentiment is fearful — which can mark an area where downside is over-positioned and a bounce becomes more likely.
- Very low PCR (lots of calls relative to puts) → the crowd is heavily long via calls. Sentiment is greedy/complacent — which can mark froth and vulnerability to a pullback.
In short: extremes in the put-call ratio often warn that sentiment is stretched, and stretched sentiment tends to snap back.
Typical ranges — and the trap of fixed thresholds
You’ll see rules of thumb like “PCR below 0.7 is bullish-extreme, above 1.3 is bearish-extreme.” Don’t trade these as hard lines. They’re a starting point, not a signal, because:
- Every instrument has its own baseline. NIFTY, BANK NIFTY and individual stocks sit at different “normal” levels. What’s extreme for one is ordinary for another.
- Baselines drift over time with market structure, expiry cycles and participation.
- The trend in the put-call ratio matters more than the absolute number. A ratio rising from 0.8 to 1.1 over a few sessions is more informative than the snapshot value alone.
The right approach is relative: compare today’s ratio to that instrument’s own recent range, and watch the direction it’s moving.
PCR (OI) vs PCR (volume)
- Put Call Ratio (OI) reflects accumulated positioning — the standing bet. Steadier, better for the broader sentiment backdrop.
- Put Call Ratio (Volume) reflects today’s flow — noisier, but quicker to flag a sudden shift in mood. Around events and expiry it can swing hard.
Many traders watch the OI version for context and glance at the volume version for intraday shifts.
How PCR behaves in NIFTY vs BANK NIFTY
When trading Indian indices, it is crucial to realize that the put call ratio does not behave the same way across different instruments. For instance, Nifty and Bank Nifty have distinct structural behaviors. If you analyze the NIFTY vs BANK NIFTY open interest, you will notice that Bank Nifty is inherently more volatile. Consequently, its put call ratio can swing violently during weekly expiries. A Nifty ratio of 1.4 might indicate an overbought zone, whereas Bank Nifty might comfortably sustain a ratio of 1.6 during strong banking rallies. Always benchmark the ratio against the specific index’s historical range rather than applying a blanket rule.
Tracking PCR on the NSE site
To track this metric accurately, you can fetch live derivative data directly from the NSE India official website. By downloading the daily option chain data, you can sum up the total open interest of put options and divide it by the total open interest of call options. Many professional traders build automated Excel sheets or Python scripts to calculate the intraday change in the put call ratio. Tracking the change in PCR (e.g., a sudden jump from 0.75 to 0.95 within an hour) is often far more predictive of an intraday trend reversal than looking at a static end-of-day number.
Combining PCR with max pain and the chain
To avoid getting trapped by false signals, smart traders never use the put call ratio in isolation. Instead, they combine it with other key open interest metrics. For example, you can overlay PCR analysis with the Max Pain Theory to find the exact strike price where the index is likely to expire. While the put call ratio gives you a macro view of market sentiment (whether the market is overall bullish or bearish), the NIFTY & BANK NIFTY option chain helps you pinpoint the exact support and resistance levels. If the put call ratio is at an extreme bearish level (e.g., 0.55) and the index is trading right at a major put writing support wall on the option chain, the probability of a sharp short-covering rally increases significantly.
Intraday approaches
Here are two practical ways to incorporate the put call ratio into your daily trading routine:
- The Divergence Setup: If the Nifty index is making new lows intraday, but the put call ratio is making higher lows (refusing to drop further), it indicates that put writing is starting to outpace call writing at lower levels. This bullish divergence often precedes a sharp intraday bounce.
- The Extreme Exhaustion Play: During high-momentum expiry days, the put call ratio can reach extreme levels. If you are trading expiry day using open interest, look for PCR extremes (like < 0.6 or > 1.5) coinciding with key technical levels. When the ratio stops expanding at these extremes, it is a signal that the prevailing trend is running out of steam, offering a high-R-multiple contrarian trade opportunity.
Using PCR with other signals
The put call ratio is a context tool, not a trigger. It works best layered with the rest of your read:
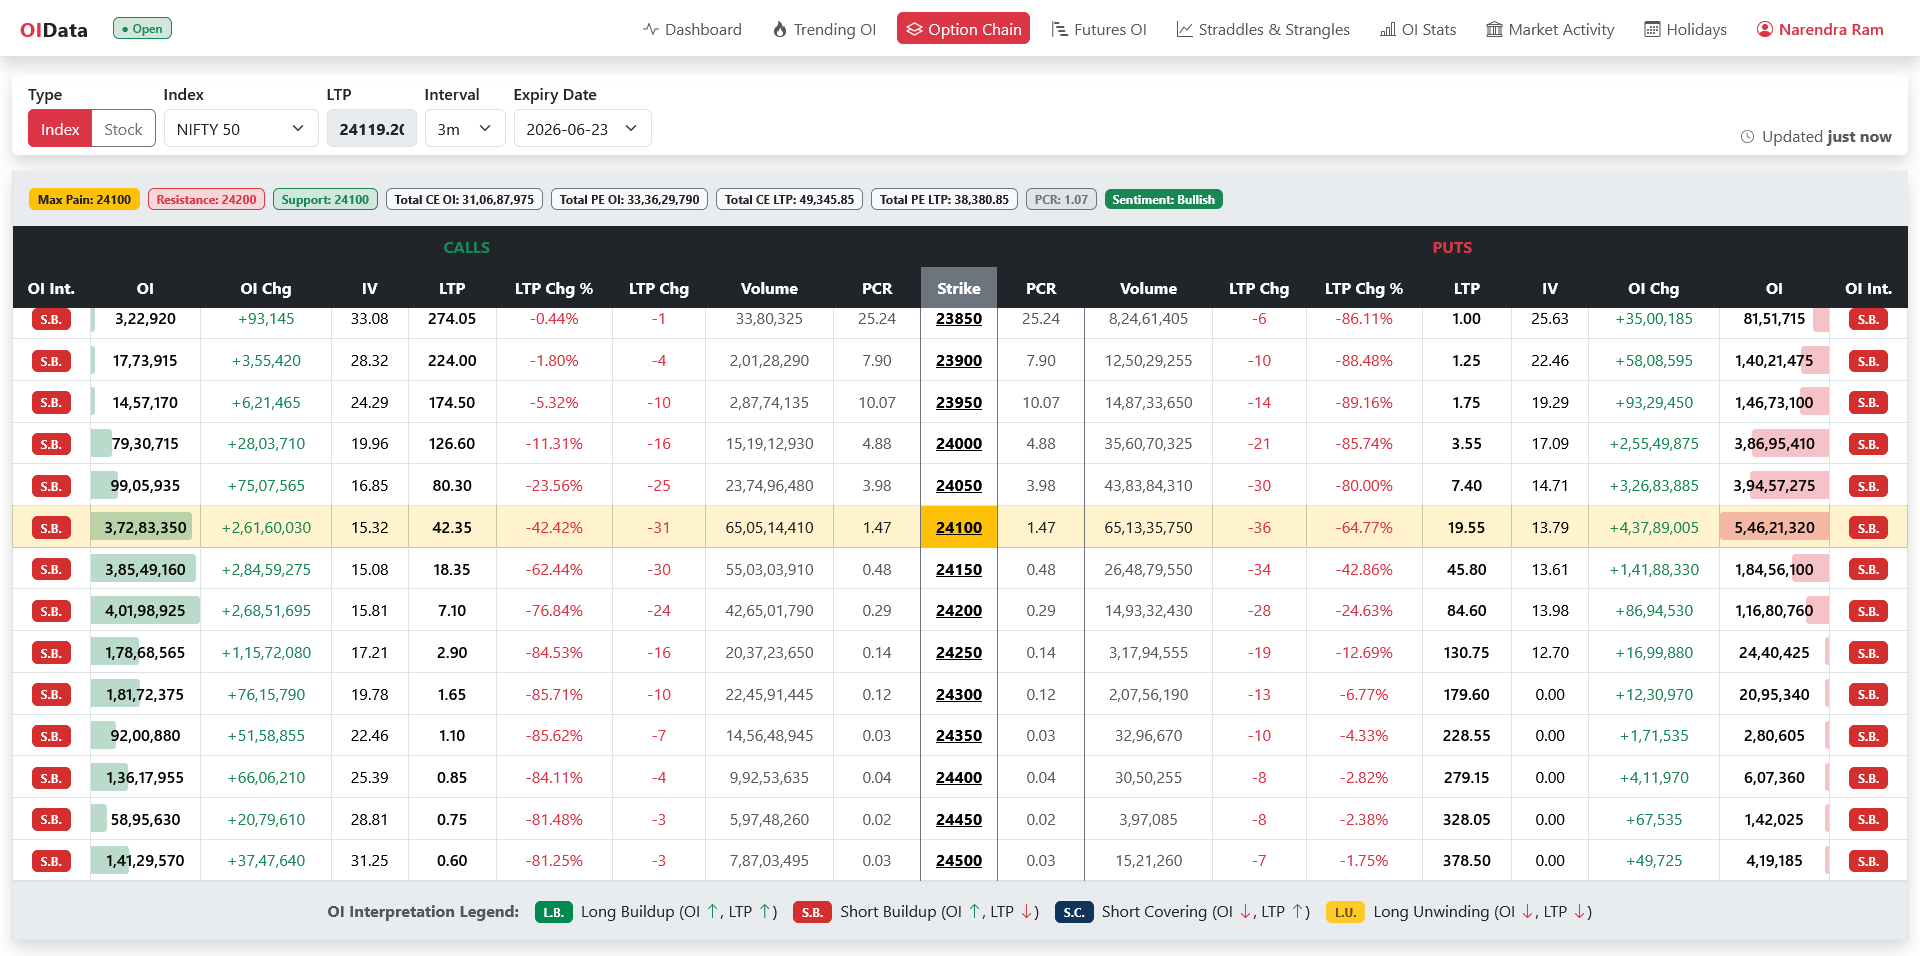
- The option chain. PCR summarises the whole chain in one number, but the option chain shows you where the puts and calls sit — i.e., the actual support and resistance walls.
- Buildup signals. Pair PCR with OI buildup on the futures to see whether positioning and price action agree.
- Price itself. A stretched PCR only becomes actionable when price confirms the turn. Sentiment can stay extreme longer than you expect.
Caveats
- Composition matters. The put call ratio lumps buyers and writers together; it can’t tell you, by itself, who’s hedging versus speculating.
- Expiry skews it. As contracts settle and roll, OI shifts across series and the ratio can jump for mechanical reasons.
- It’s a gauge, not a system. No single threshold “works.” Treat the ratio as one input among several, always read relative to the instrument’s own history.
On OIData
The OI Stats page and the Dashboard surface put and call open interest so you can track the put call ratio and, more importantly, how it’s changing — and the Option Chain shows you exactly where that put and call OI is concentrated.
Related reading
The gamma-weighted cousin of this ratio is covered in gamma exposure explained, and you can have a level crossing delivered to you with open interest alerts.
Takeaways
- Put call ratio = total put OI ÷ total call OI (an OI version and a volume version exist).
- It’s often a contrarian gauge, because much put OI comes from writers — extreme readings flag stretched sentiment.
- Avoid fixed thresholds. Read the put call ratio relative to the instrument’s own range and watch its trend.
- It’s context, not a trigger — confirm with the option chain, buildup signals and price before acting.