Open interest is one of the most useful tools in an options trader’s kit — and one of the most frequently misread. The raw data published by exchanges like the National Stock Exchange of India (NSE) is highly reliable; the interpretation is where people go wrong. Avoiding the ten mistakes below will save you a lot of money. Here are the ten common mistakes that catch most Indian retail traders off guard, along with actionable advice on how to sidestep each. Think of this guide as a complete checklist to run before you act on any major F&O open interest signal.
1. Watching the raw OI total instead of the change
A huge open-interest number can be weeks old and tell you nothing about today. The fresh information is in change in OI — where positions are being added or cut right now. Always lead with the change, not the headline total. In highly active Indian indices like Nifty or Bank Nifty, analyzing the intraday shift in OI tells you exactly where the immediate intraday momentum is building, whereas cumulative OI simply tells you historic positions.
2. Confusing open interest with volume
They look alike but answer fundamentally different questions: volume = activity (resets daily), while open interest = commitment (carries over). Mixing them up leads to bad conclusions. Volume measures how many contracts changed hands today, regardless of whether they were new positions or liquidations. Open interest measures the total number of outstanding contracts that have not been settled. If this distinction still trips you up, revisit Open Interest vs Volume.
3. Treating high OI as a directional signal by itself
OI on its own isn’t inherently bullish or bearish. It only becomes a reliable signal when you pair it with price — that’s the whole point of the buildup framework (long buildup, short buildup, covering, unwinding). High OI without a price read is just a crowd, not a clear market direction. You must watch how price reacts to additions in open interest to determine whether bulls or bears are aggressive.
4. Forgetting that option OI is ambiguous
In options you also have to account for premium direction, because rising OI at a strike can mean buying or writing — with opposite market implications. A rising call OI with a falling premium is typically writing (bearish for that level); with a rising premium it is buying (bullish). Always check the option’s premium price, or use futures, where long-vs-short positioning is much less ambiguous. For a deeper dive, see our guide on Futures OI Analysis.
5. Ignoring expiry distortion
As a monthly or weekly series nears its expiry day, its OI collapses to zero mechanically as traders settle, liquidate, or roll their contracts. Reading that sharp drain as a bearish “unwinding” signal is a classic rookie error. Near expiry, shift your attention to the next series to track rolls, and make sure to account for this predictable rollover activity.
6. Trusting intraday OI as if it were final
Intraday OI is a useful live hint, but the end-of-day figure is the authoritative one. The exchange processes and reconciles trades post-market, meaning the live numbers you see on your terminal during trading hours can be subject to adjustments. Don’t build a high-conviction overnight positional trade on a mid-session intraday number that may revise significantly by the close.
7. Trading max pain and PCR as mechanical triggers
Max pain is a tendency, strongest near weekly expiry and easily overridden by a strong trending market. Similarly, the PCR has no magic threshold — “above 1 = sell” is a dangerous trap. Both are contextual indicators to read relative to their recent historical range and always with price action, never as standalone buy/sell buttons.
8. Assuming “retail is always wrong”
Analyzing participant data is highly insightful, but the Client bucket on the NSE is a massive, highly mixed group — which includes seasoned HNIs, proprietary desks, hedgers, and arbitrageurs alongside retail traders. Treating the client category as a guaranteed fade is a lazy trading strategy. Additionally, remember that large institutional short positions are often complex hedges against portfolio holdings, not directional bearish bets. Read our breakdown on Pro vs Client positioning for the full nuance.
9. Anchoring to stale support and resistance
OI walls shift dynamically as the option chain changes throughout the week. The high-call-OI strike that capped Nifty’s price last week may not be the one that matters today. Re-read the levels every session rather than anchoring to old ones — see our guide on finding support and resistance from OI to see how to dynamic-map these levels.
10. Relying on one signal — and skipping risk management
The biggest mistake of all: turning a single OI read into a high-risk trade with no plan. Open interest only describes positioning, not your exact entry, stop-loss, or target. Remember that OI is one input, not the whole picture. The traders who last are the ones who treat OI as one input among several (including price action, structural levels, volume, and IV) and let strict risk management decide their actual position size.
A practical framework: OI plus price action
To use this data systematically, pair every OI reading with the underlying spot move. Because open interest represents outstanding active contracts, changes in these numbers highlight institutional commitment.
Here is the standard four-quadrant matrix used by professional derivatives traders in the Indian stock market: 1. Rising Price + Rising Open Interest = Long Buildup: Buyers are aggressively entering new long positions. This indicates strong bullish sentiment. 2. Falling Price + Rising Open Interest = Short Buildup: Sellers are aggressively creating new short positions. This suggests strong bearish conviction. 3. Falling Price + Falling Open Interest = Long Unwinding: Bullish traders are closing out their long positions, leading to a downward correction. 4. Rising Price + Falling Open Interest = Short Covering: Bearish traders are rushing to cover their shorts, which artificially pumps the price up.
Understanding this matrix is the bedrock of OI buildup analysis. When you combine these quadrants with volume, you get a highly transparent picture of what big institutional players are doing.
Reading OI in the option chain
Options data is more complex than futures because every option transaction involves a buyer and a seller with opposing views. However, in the Indian F&O space, option writing (selling) is typically dominated by well-capitalized institutional players. Therefore, when looking at the Nifty and Bank Nifty option chains, we generally read the open interest from the seller’s perspective.
To read support and resistance off the chain: - High Call Open Interest acts as a strong ceiling or resistance level. Writers of call options believe the underlying asset will not rise above this strike price by expiry. - High Put Open Interest acts as a strong floor or support level. Writers of put options believe the underlying asset will not fall below this strike price by expiry.
When the underlying price approaches a high-OI strike, expect volatility or a reversal unless the wall begins to break, triggering sharp short-covering or long-unwinding moves.
A pre-trade checklist
Before acting on any OI read, ask yourself:
- Am I looking at the change in OI, not just the cumulative total?
- Have I confirmed it with price action (and, for options, the option’s own premium price)?
- Is weekly or monthly expiry distorting this data?
- Is this number end-of-day or just an intraday snapshot?
- Am I treating max pain, PCR, and participant data as context, rather than mechanical triggers?
- Where is my stop-loss, and what is my position size?
If you can answer those cleanly, you’re already ahead of most market participants.
On OIData
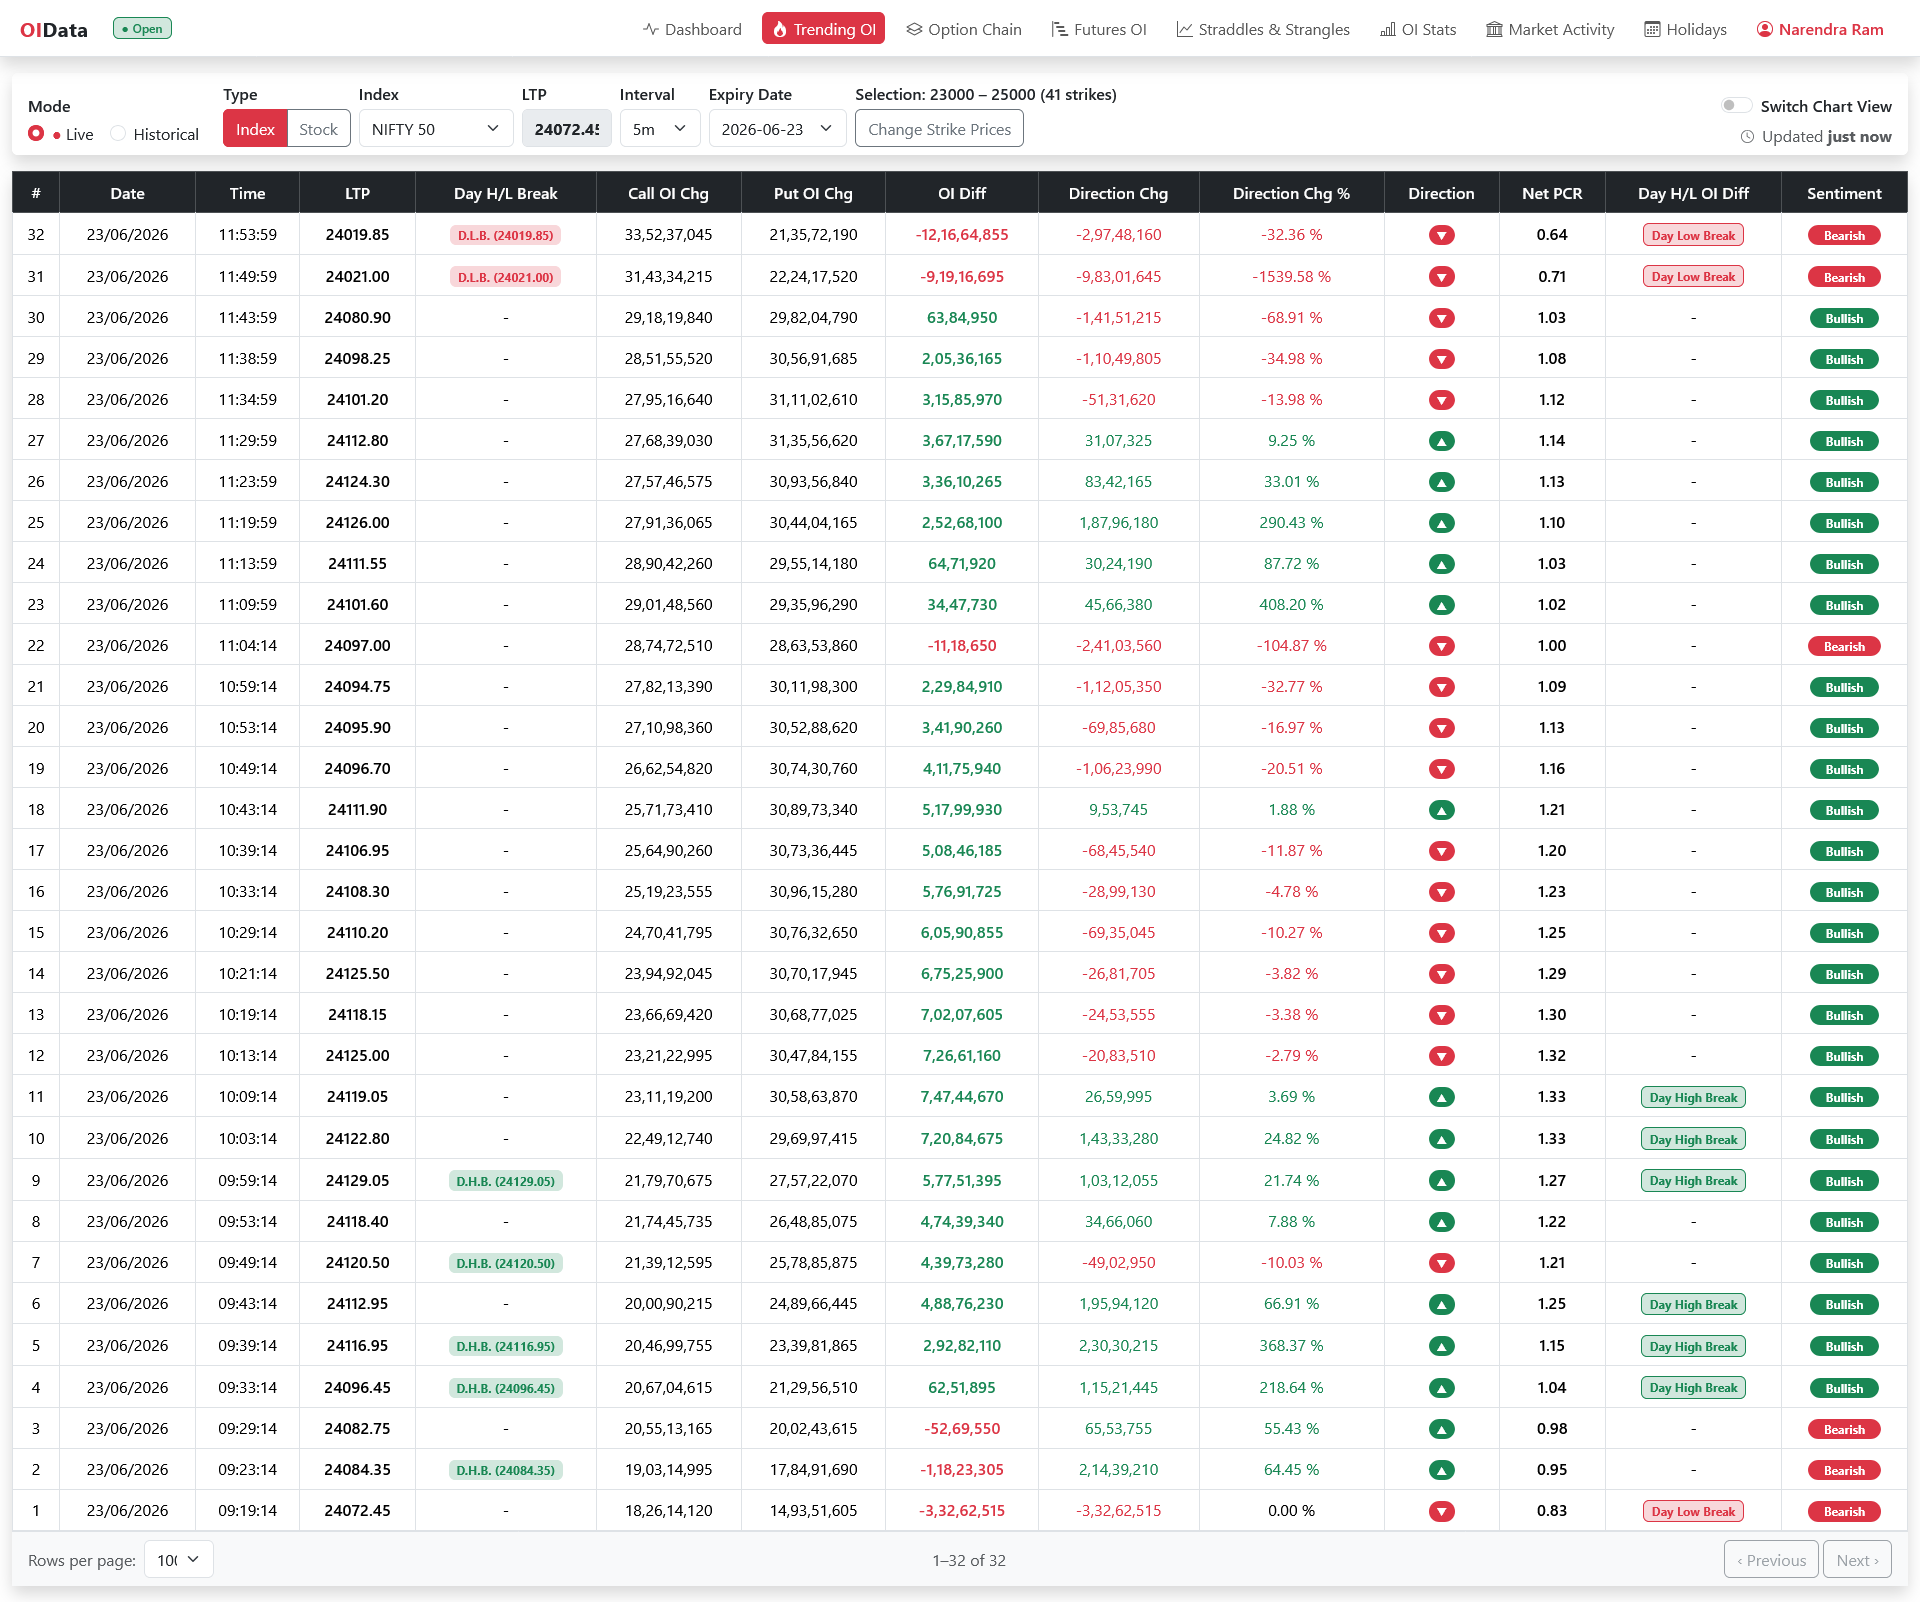
Our platform is designed to keep you on the right side of these common mistakes: the Option Chain tools foreground change-in-OI, Trending OI shows where positioning is actively shifting in real-time, Futures OI gives you a clean directional read on F&O stocks, and the Dashboard ties everything together with participant positioning and volatility context.
Related reading
Mistake eleven is waiting for OI to tell you something volume already has — see unusual options activity — and you can automate the levels worth watching with open interest alerts.
Takeaways
- Lead with change in OI, not the raw total, and never analyze OI without checking price.
- Mind the common traps: OI is not volume, option OI is ambiguous, expiry distorts, and EOD is authoritative.
- Treat max pain, PCR and participant data as market context, not triggers — and don’t assume retail clients are always wrong.
- Re-read levels daily, and let risk management — not any single technical indicator — drive your trading decisions.